cost anomalies
Cloud Cost Anomalies: Detection and Response Guide
An Azure cost anomaly that runs three weeks is a four-figure mistake. Real-time detection: baselines, scoping, alert routing — and the response playbook.
A cost anomaly is any unexpected deviation from a workload’s normal spend pattern. The textbook examples — left-on dev VMs, runaway ADF pipelines, a logging tier accidentally set to premium — are real, but the cost is rarely the spike itself. The cost is the time between the spike starting and someone with authority noticing it.
On a monthly invoice cycle, that gap is three weeks. A $3k/day misconfiguration caught in week one is a $21k mistake; the same misconfiguration caught at invoice review is a $90k mistake. Real-time detection is not a nice-to-have — it is the difference between a phone call and a board-level variance.
What real-time detection requires
Three things, in order:
1. A baseline per cost group, not per subscription. “Azure is up 8% this month” is not actionable. “The data-pipeline cost group is up 38% in the last 48 hours” is. The baseline has to be scoped to a unit small enough for one team to investigate — typically a cost group of 20–200 resources owned by a single team. Anomaly models built on the whole tenant produce alerts no one owns.
2. Detection that learns the rhythm of the workload.
A nightly ETL job costs more on weeknights than weekends. A retail workload costs more in November than February. Static thresholds (alert if >20% over yesterday) produce a flood of false positives on every Monday morning. Useful detection compares to the workload’s own seasonal pattern, not to a global average.
3. Routing that lands in the workflow the owner already uses. An anomaly alert in a dashboard nobody opens is the same as no alert. The signal has to land where the team already lives — Teams for engineering, email digest for finance, ITSM ticket for the on-call rotation. Anything else gets ignored.
What to do once an anomaly fires
Most anomalies fall into four buckets. Triage in this order:
- Misconfiguration. Premium tier where standard was intended, a non-prod region with a prod-tier SKU, a forgotten autoscale rule. Fix the config, file a postmortem if it touches a production system.
- Left-on resource. Dev environment running over a weekend, load test that didn’t get torn down, an unused App Service plan. Schedule it off, add a tag-based lifecycle policy.
- Architectural pattern. A cache that’s now a database, a logging tier that’s now an analytics tier, an egress pattern that crossed a region boundary. This is the most expensive bucket because the fix is engineering work, not a config change. Track it as a backlog item with a cost estimate.
- Real growth. The workload is busier because the business is busier. This is the correct outcome — make sure it is captured in the next forecast and not treated as waste.
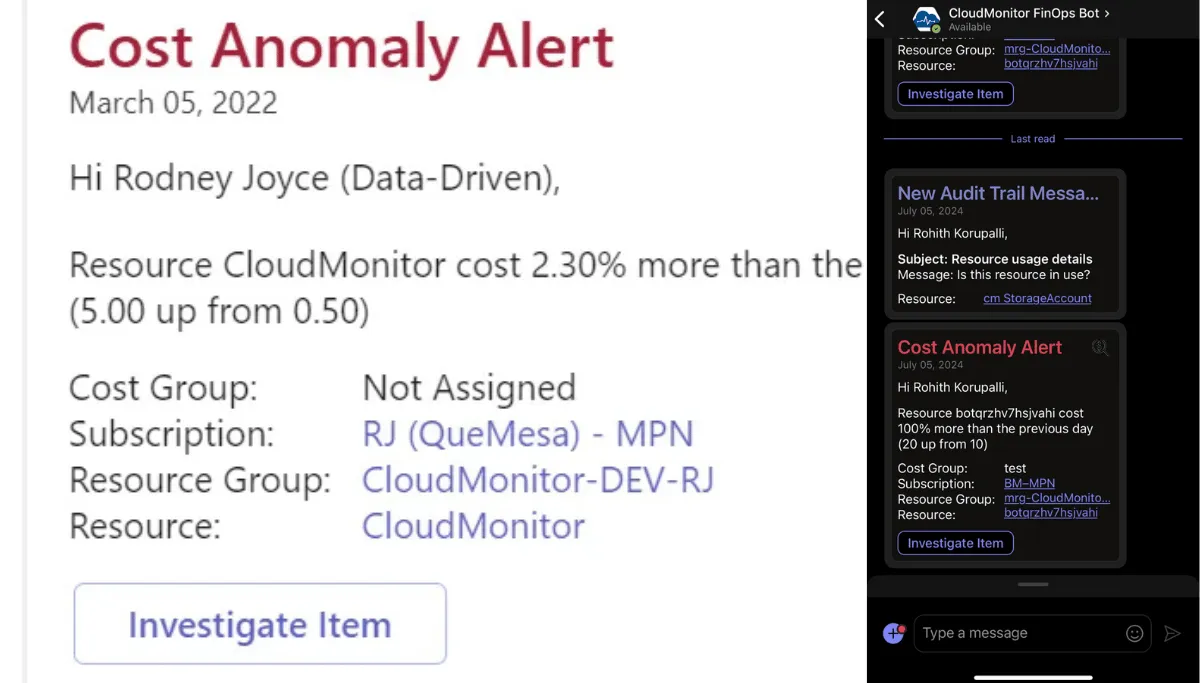
Where CloudMonitor fits
CloudMonitor builds a per-cost-group baseline from 30 days of usage, scores deviations against that baseline, and routes anomalies into the right Teams channel via the Anomaly Management capability. The Teams card includes severity, the resources driving the deviation, the $/day delta, and acknowledge / snooze / close actions inline — so the triage path stays inside the tool the engineer is already in.
The decision still belongs to the human in the loop. CloudMonitor surfaces the signal and the context. The owner decides whether to scale back, accept the change, or escalate.