Solution
Granular visibility into every Azure resource.
See every resource, every subscription, every cost group, every tag. Drill from $1.2M monthly spend down to a single VM in three clicks.
The problem
Visibility, but not as you know it.
Azure Cost Management gets you 80% of the way.
But the last 20% — cost groups, ownership, tag rules — is where the value lives.
Spreadsheet reconciliation eats the FinOps team's week.
Every month, the same exports, the same pivots, the same headaches.
Engineers can't see what their own services cost.
And finance can't see why a service costs what it does.
How CloudMonitor answers
What CloudMonitor gives you.
12 pre-built Power BI reports.
Cost group, cost-by-tag, anomaly, recommendation, RI summary, more — and they're yours to customize.
Drill from $ to resource.
Every report cross-filters. Click a cost group → see the resources. Click a resource → see the bill lines.
Row-level security.
Engineers see their cost group. Finance sees everything. Auditors see the audit trail.
Reports
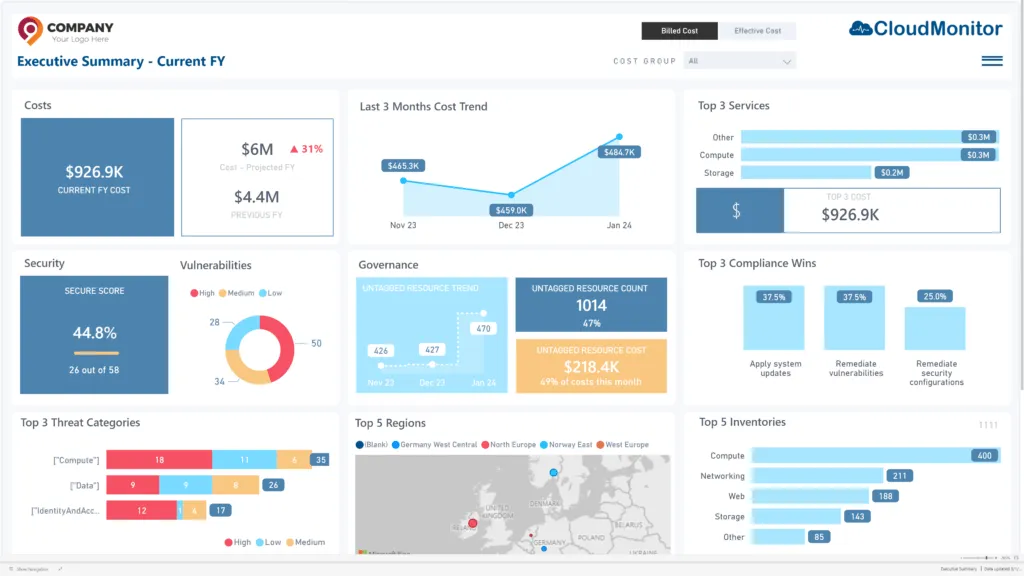
The Executive Dashboard is just the entry point.
From there, drill into Cost by Cost Group, Cost by Tag, Cost by Resource, Anomalies, Recommendations, RI Summary, Forecast — all cross-filtered, all in one app.
- 12 Power BI reports out of the box
- Custom dimensions via virtual tags
- MoM, QoQ, YoY variance views
- Exportable to PPT / Excel / Teams
Outcomes
Visibility outcomes.
12
Pre-built Power BI reports
< 3 clicks
From $1.2M to a single resource
5 levels
Of cost-group hierarchy depth
See the reports on real Azure data.
Try the live demo or sign up free.