[PowerShell] Step 1: Download the CloudMonitor Analytics Engine in Azure
Step 1
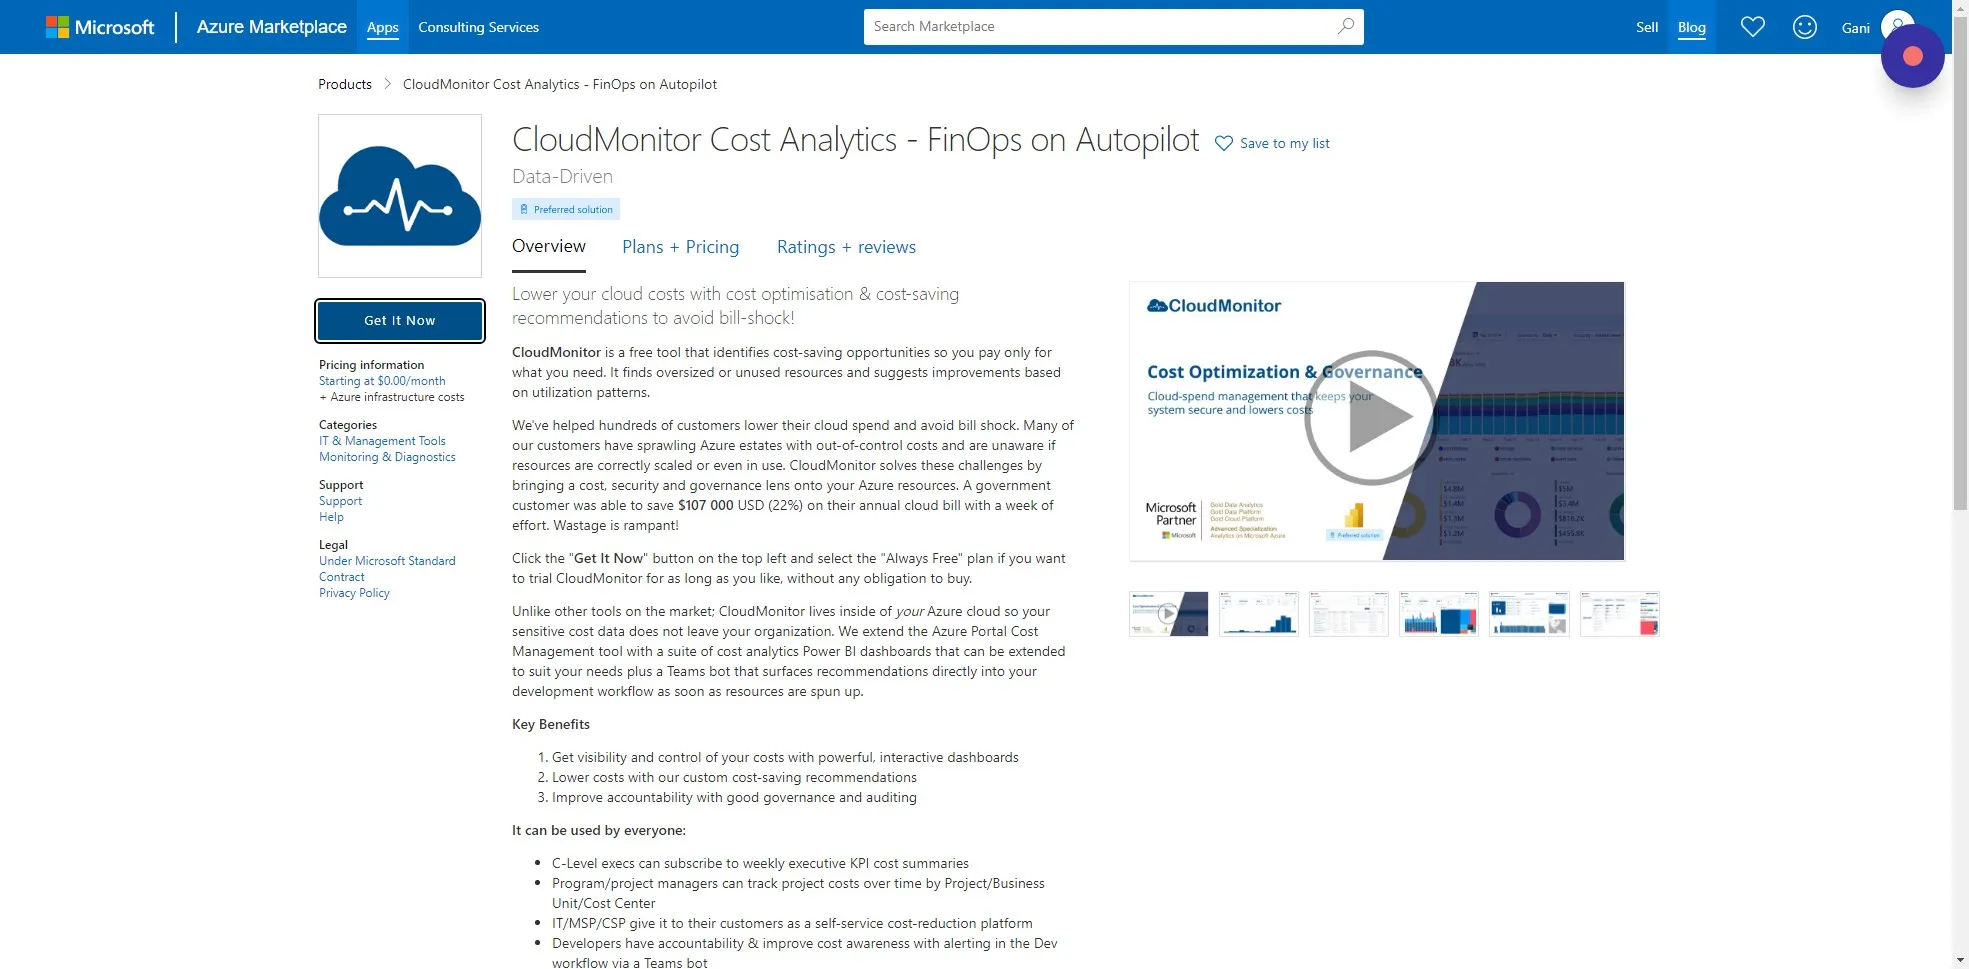
Section titled “Step 1”Go to the Azure Marketplace to install the Analytics Engine. Note: you will need to sign in with your Microsoft work or school account: (Right-click on the link) Azure Marketplace - CloudMonitor Analytics Engine
Step 2
Section titled “Step 2”Click “Get It Now” and sign in if required.
Step 3
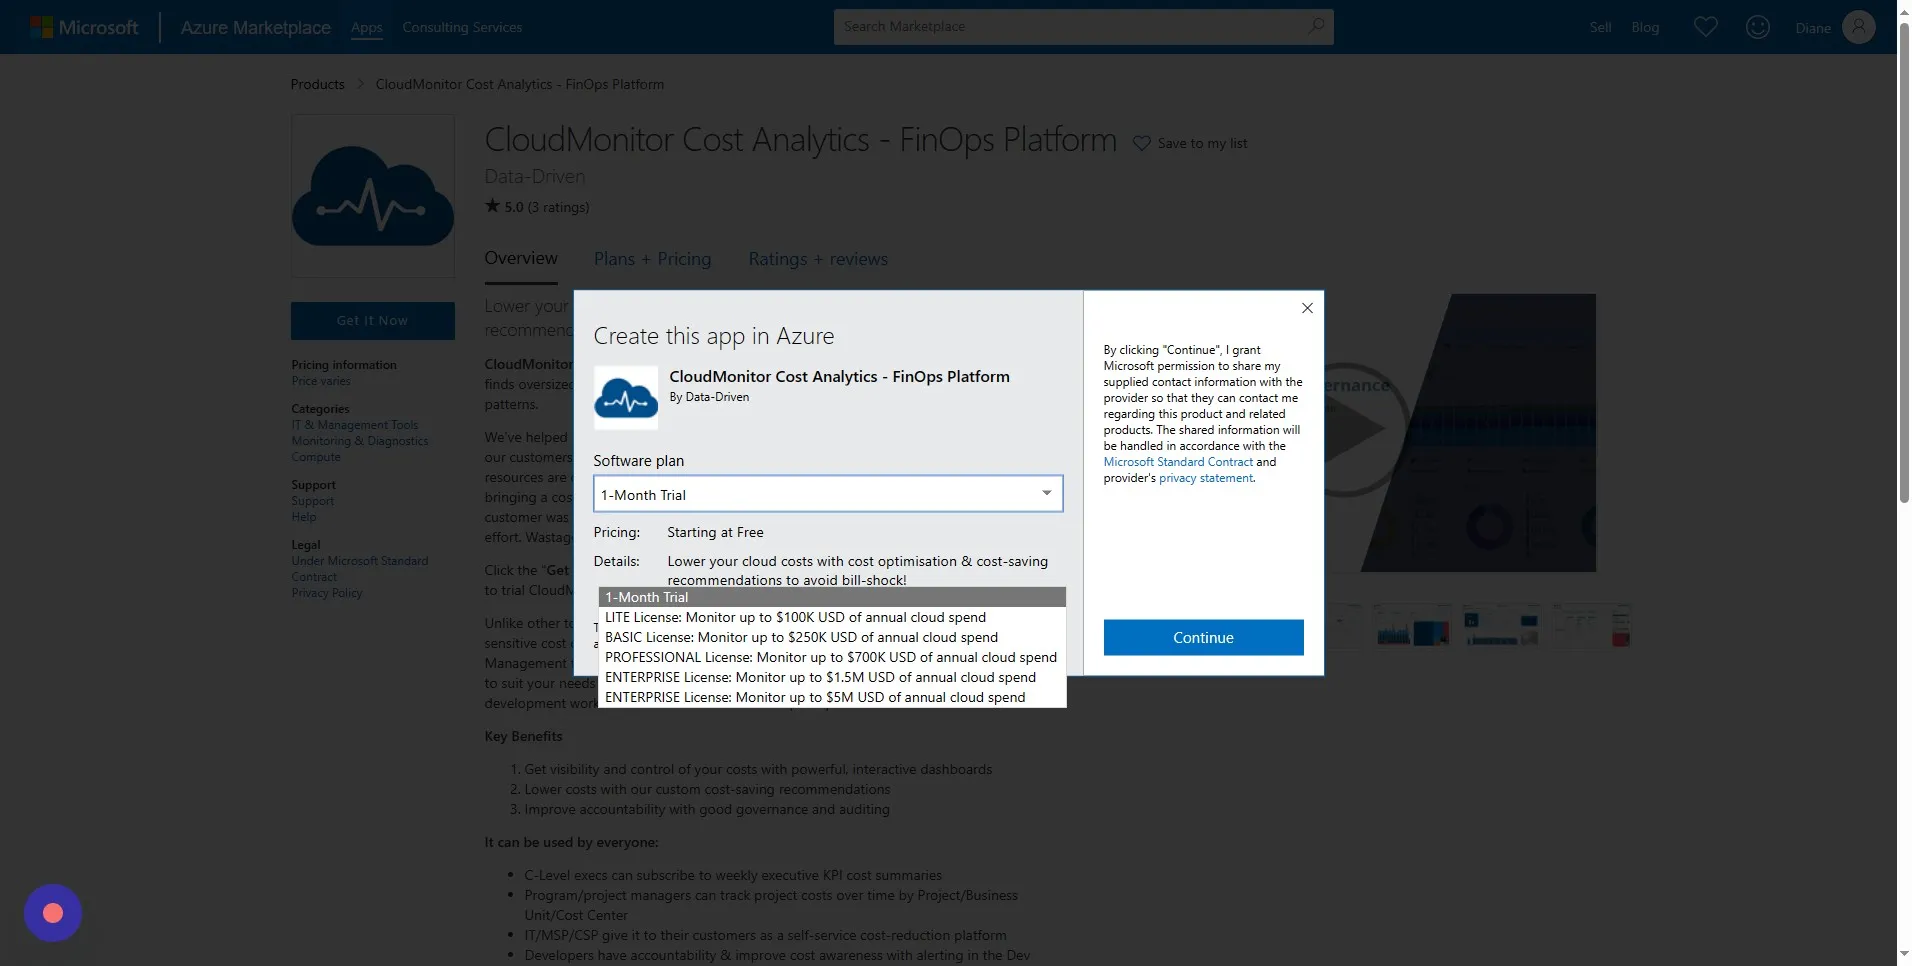
Section titled “Step 3”Choose the “1-Month Trial” or select a different plan. Click Continue.
Step 4
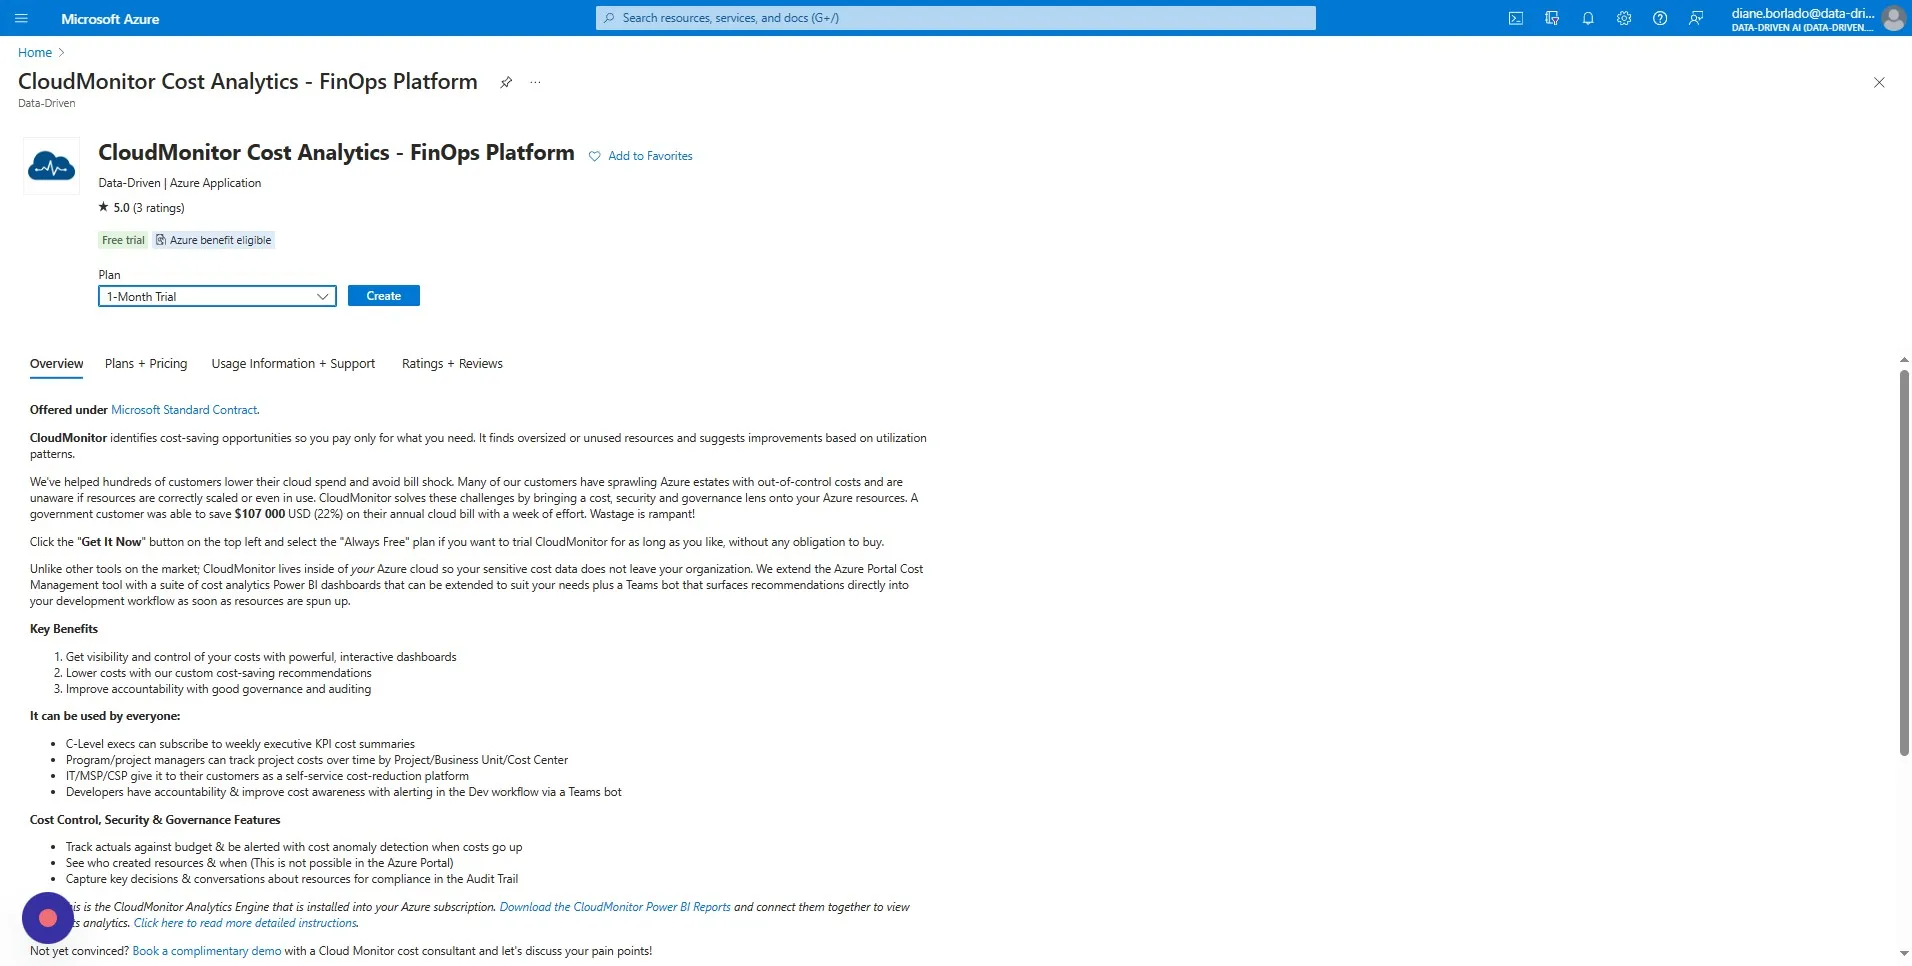
Section titled “Step 4”Select the same plan you selected before and click on “Create”. This will take you through a series of questions to personalise your installation.
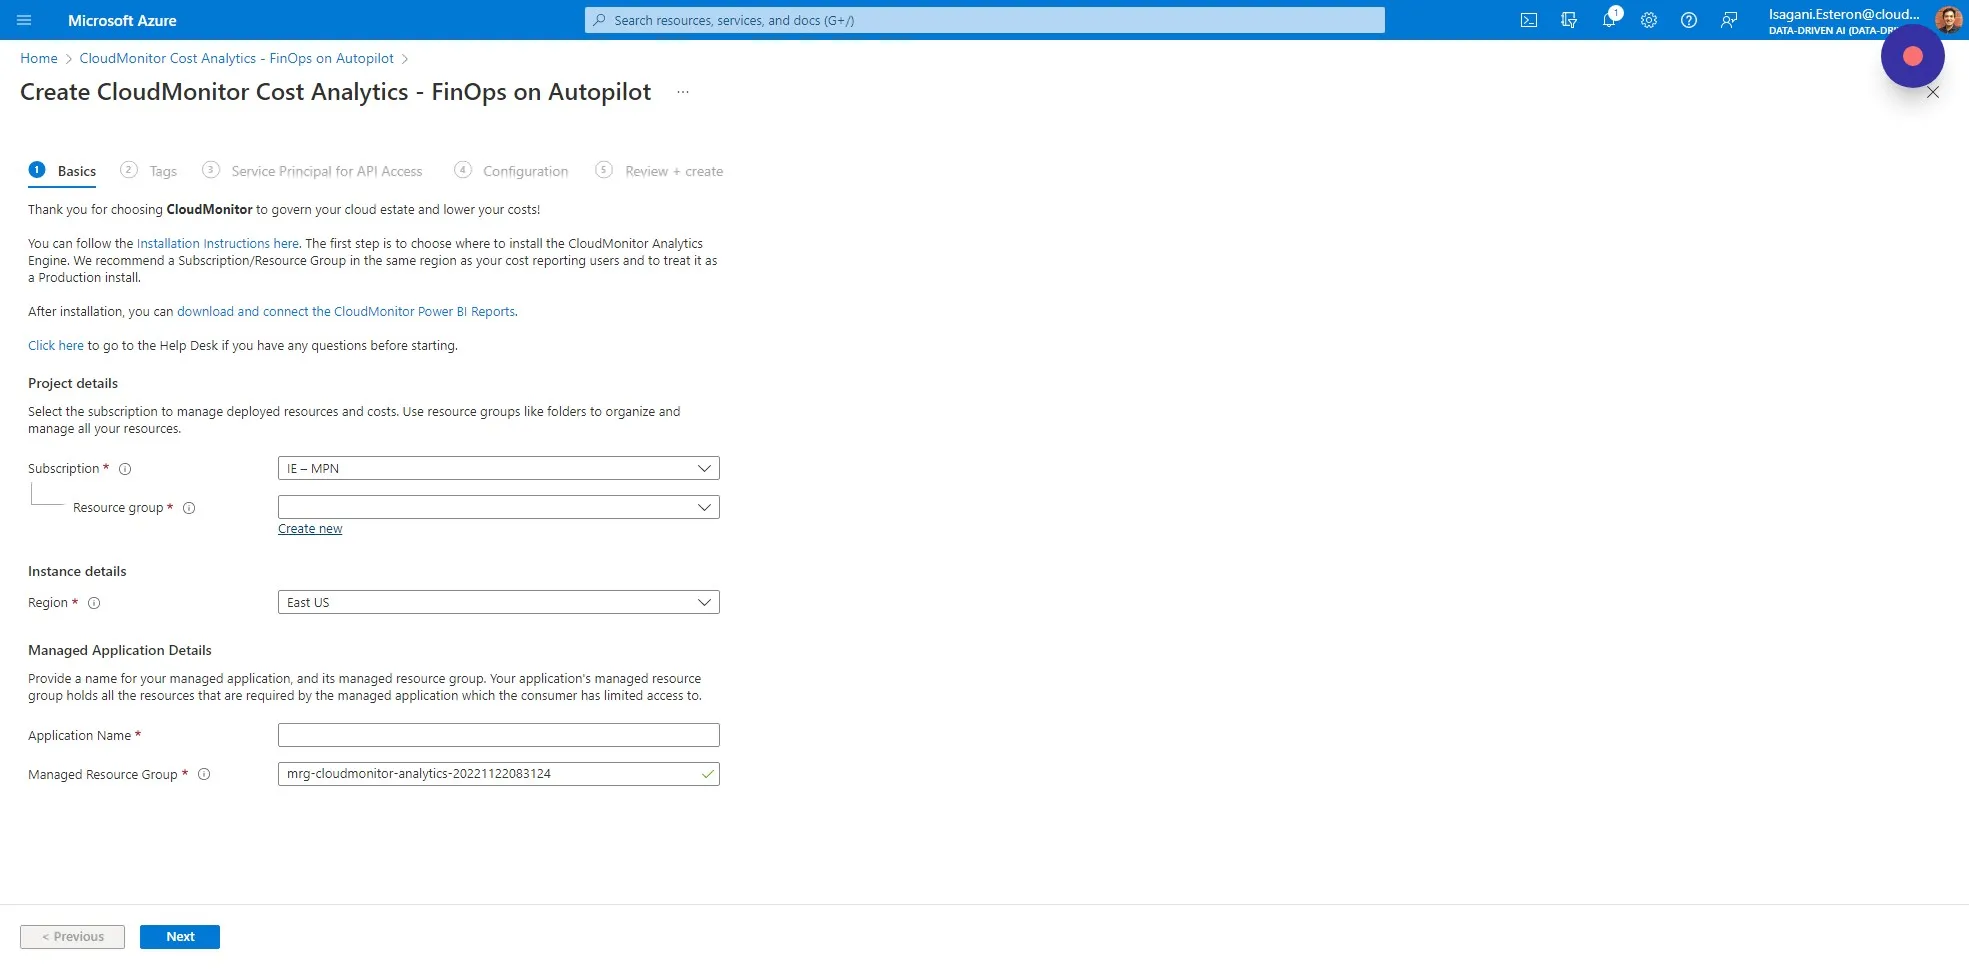
Step 5
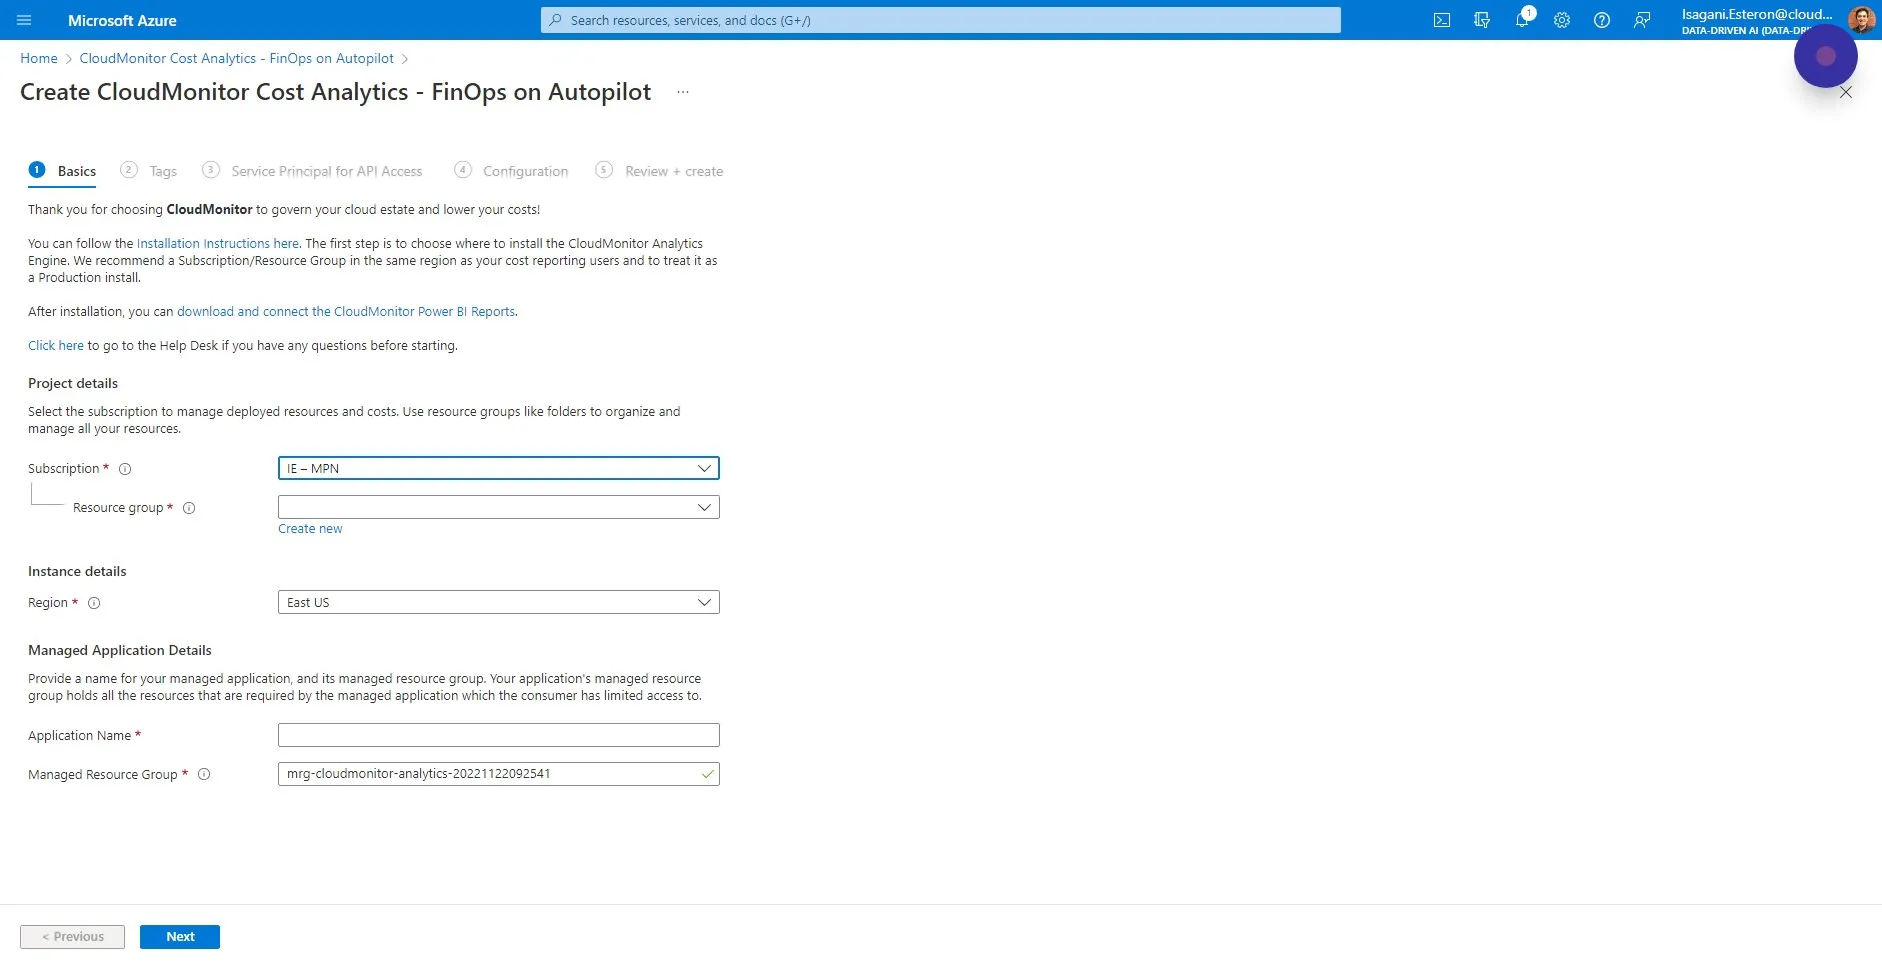
Section titled “Step 5”Choose an Azure Subscription in your environment where you would like to install CloudMonitor. This is NOT the Subscriptions that you want to monitor, just where you want to put the CloudMonitor Application.
For example, if you are trialing it, you might install it on a DEV Subscription, whereas if you are monitoring production resources you might want to install it on a Production Subscription.
In our example below we are using a Subscription called “IE - MPN”.
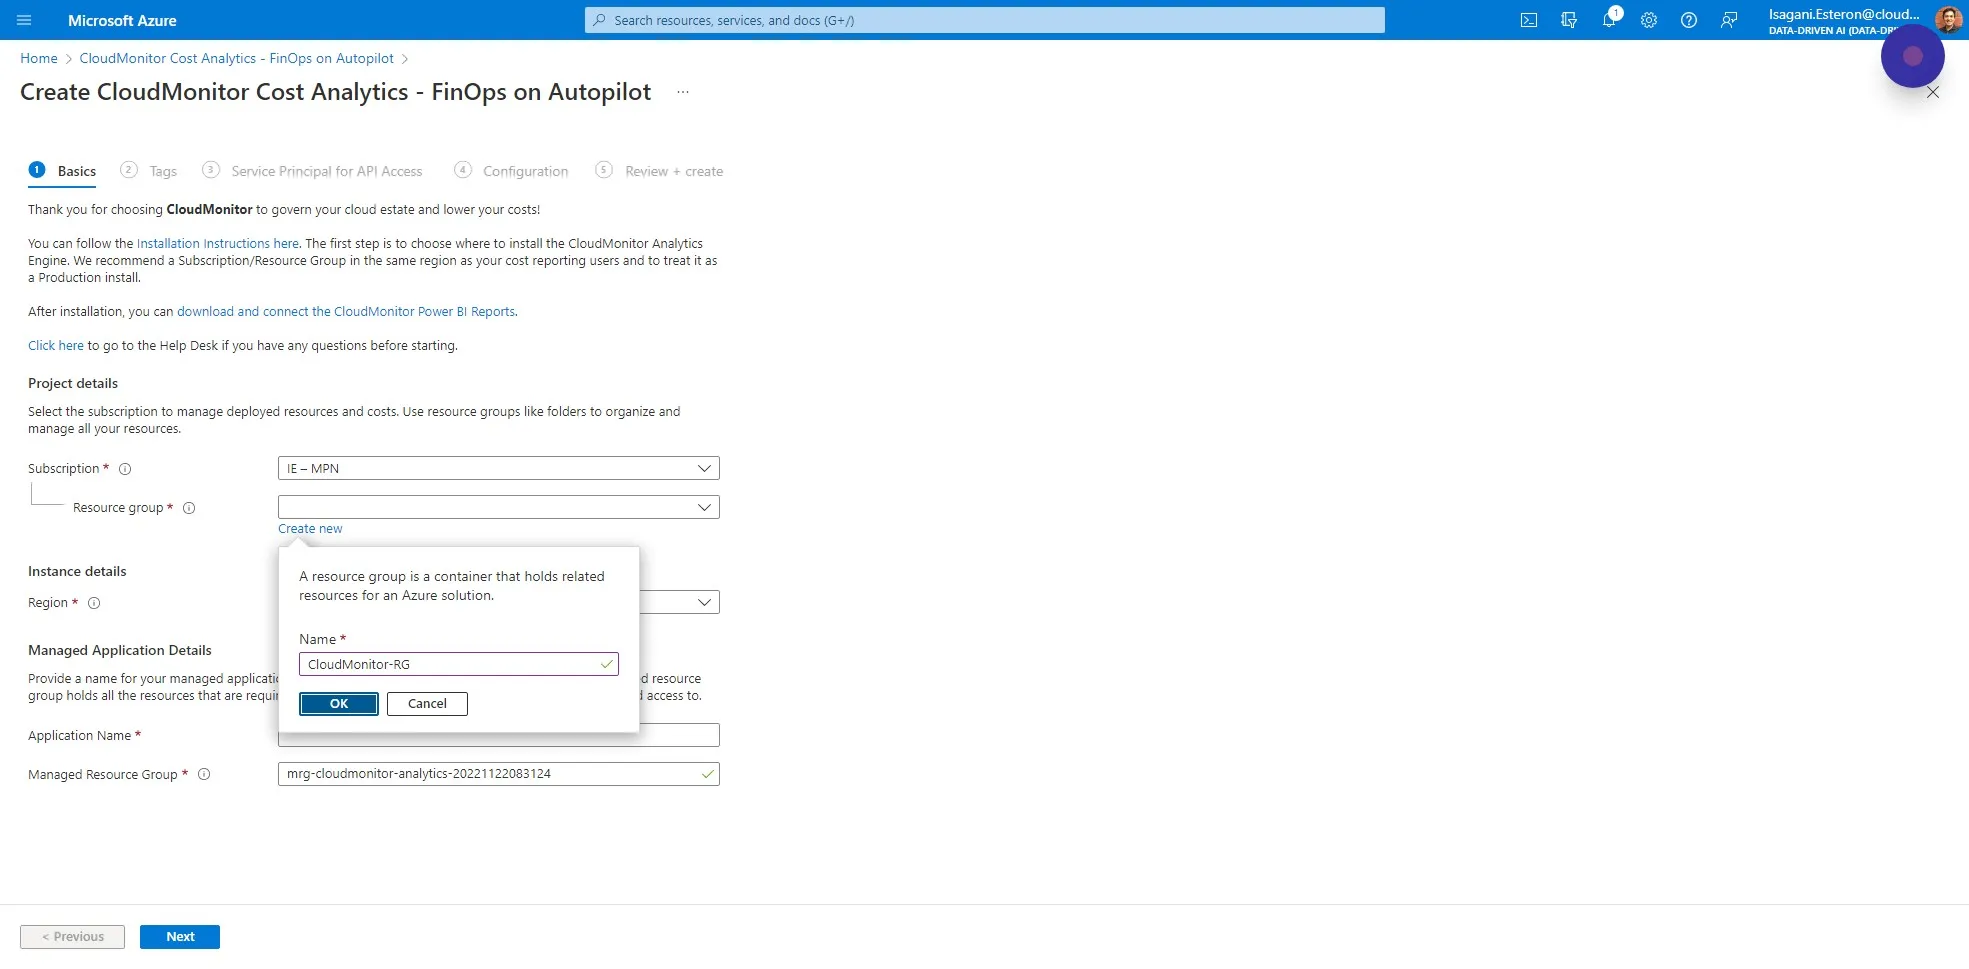
Step 6
Section titled “Step 6”We recommend always creating a new Resource Group.
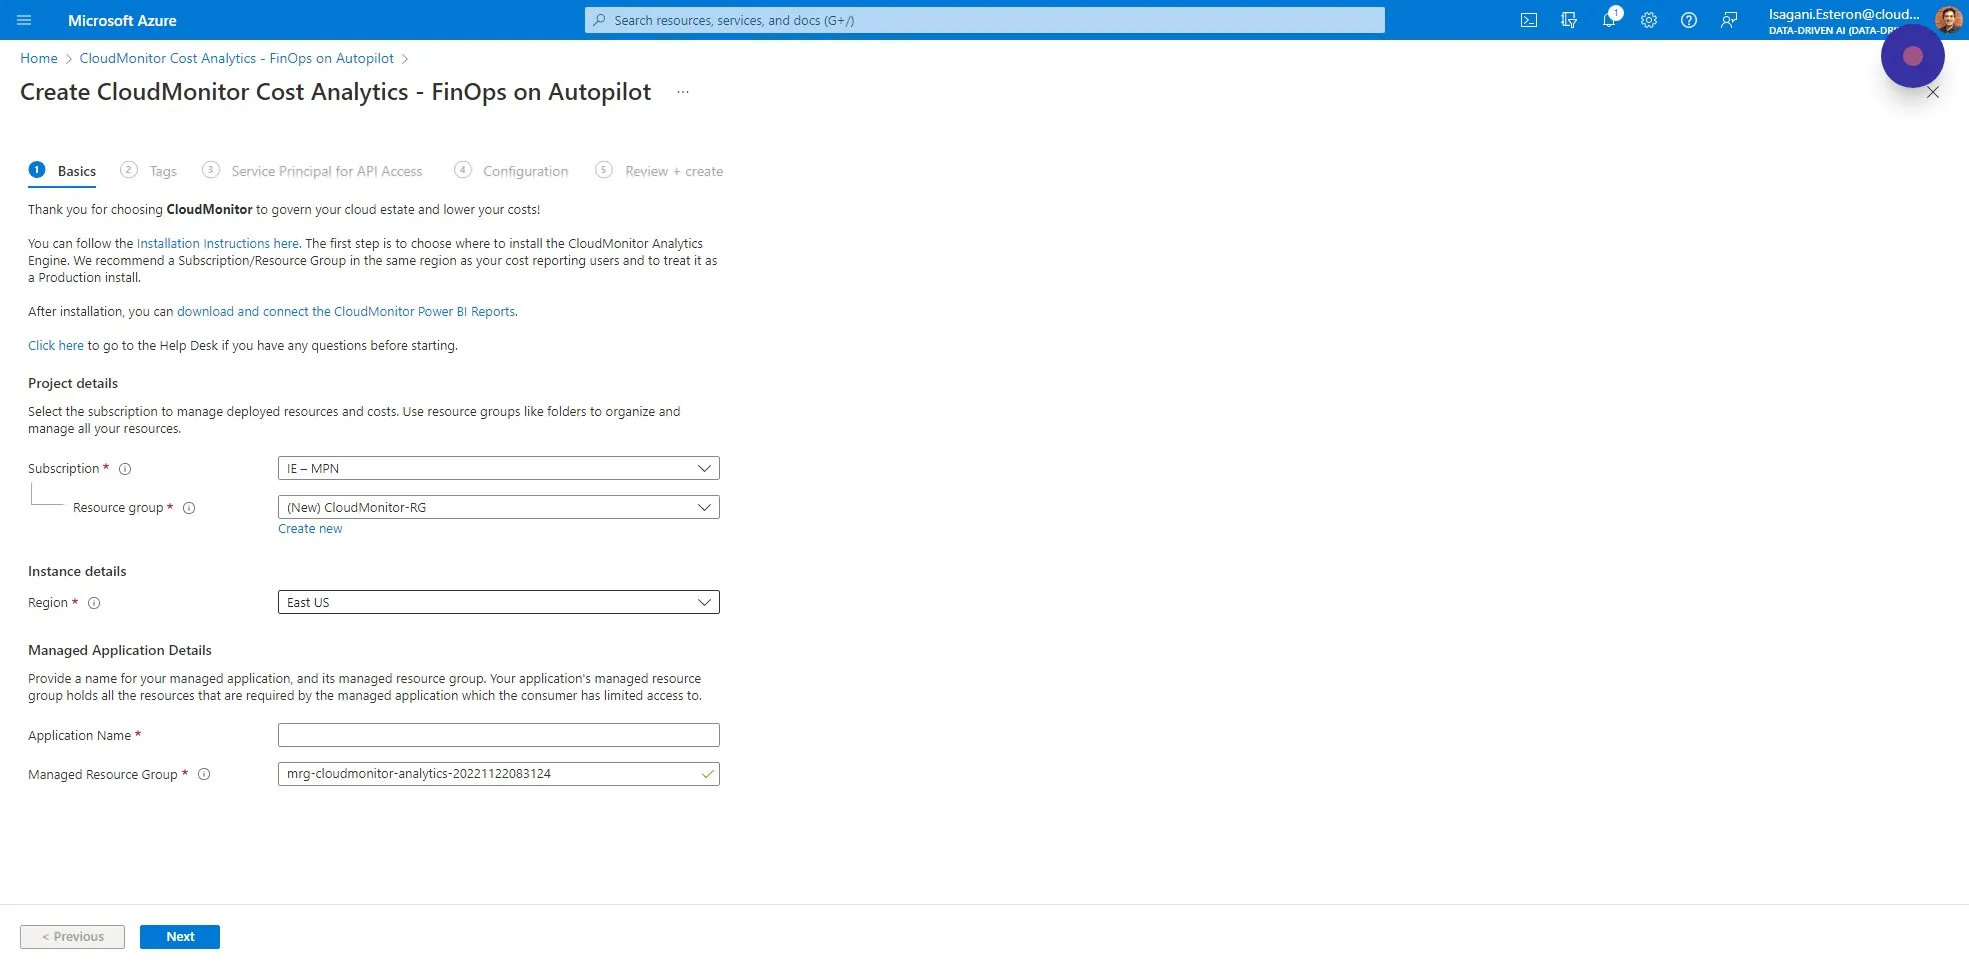
Step 7
Section titled “Step 7”Enter “CloudMonitor” as the Resource Group name and click “OK” (We used “CloudMonitor-RG” in our example below).
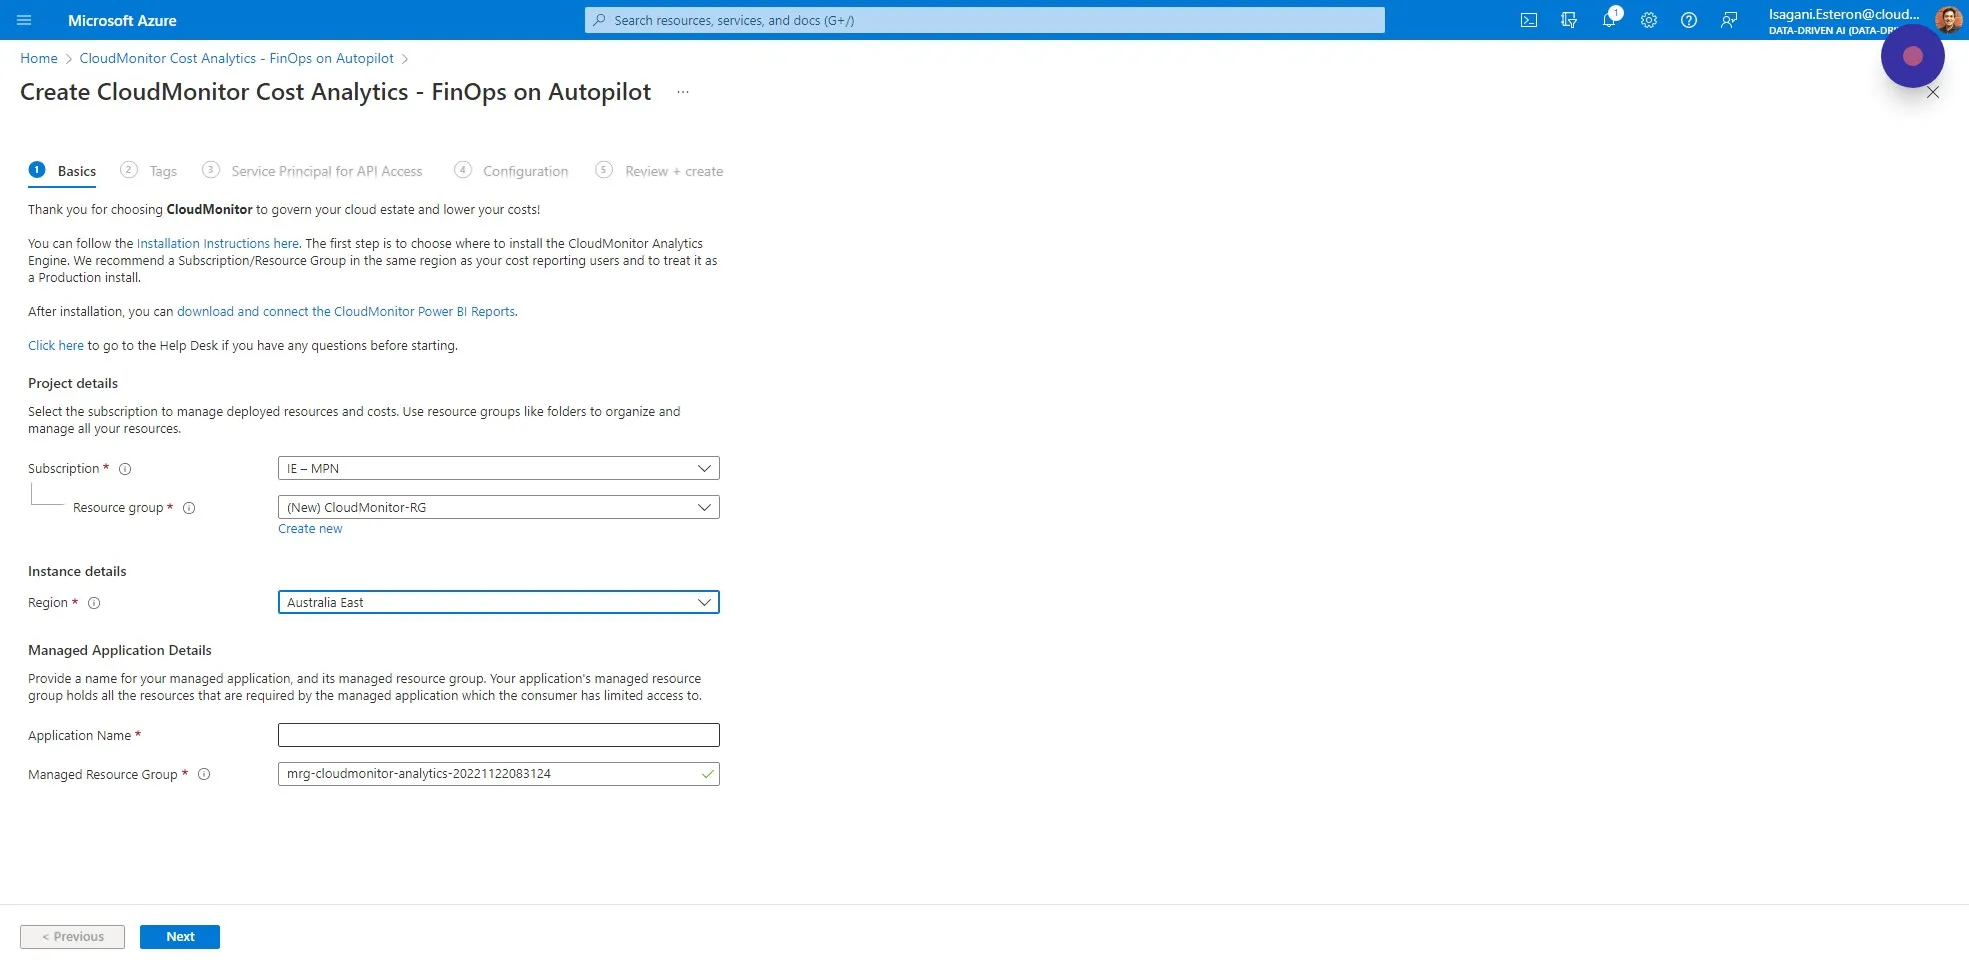
Step 8
Section titled “Step 8”Choose a Region where you want to install CloudMonitor. It makes sense to choose the region closest to your other Azure Subscriptions that you will be monitoring.
Step 9
Section titled “Step 9”Fill in the Application Name as “CloudMonitor” or something similar and click on Next.
Step 10
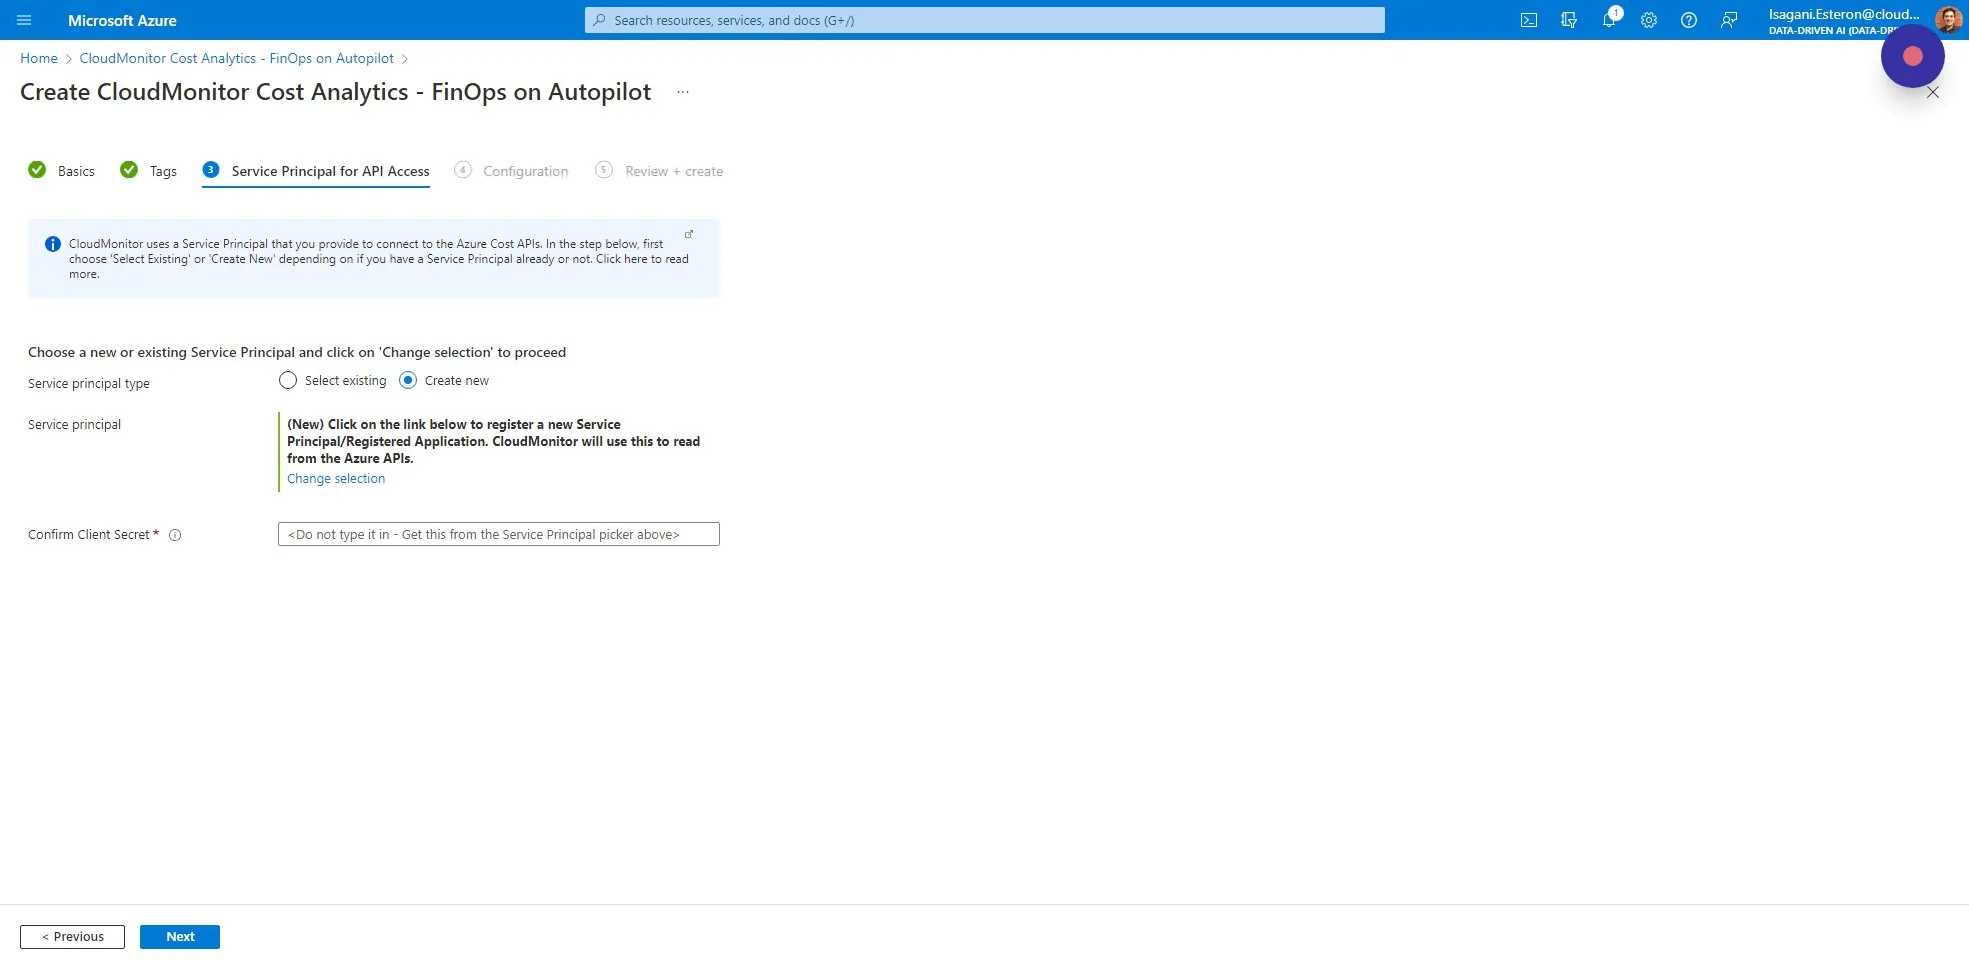
Section titled “Step 10”The next step is to create the Azure AD Service Principal that reads the cost metadata for the Azure Subscriptions that you want to monitor. You will need to have the permissions to create Service Principals in Active Directory, or you could ask your Admin to create it and provide you with the Client ID and Secret. We will assume you have the required permissions.
Choose “Create new” and click on Change Selection.
Step 11
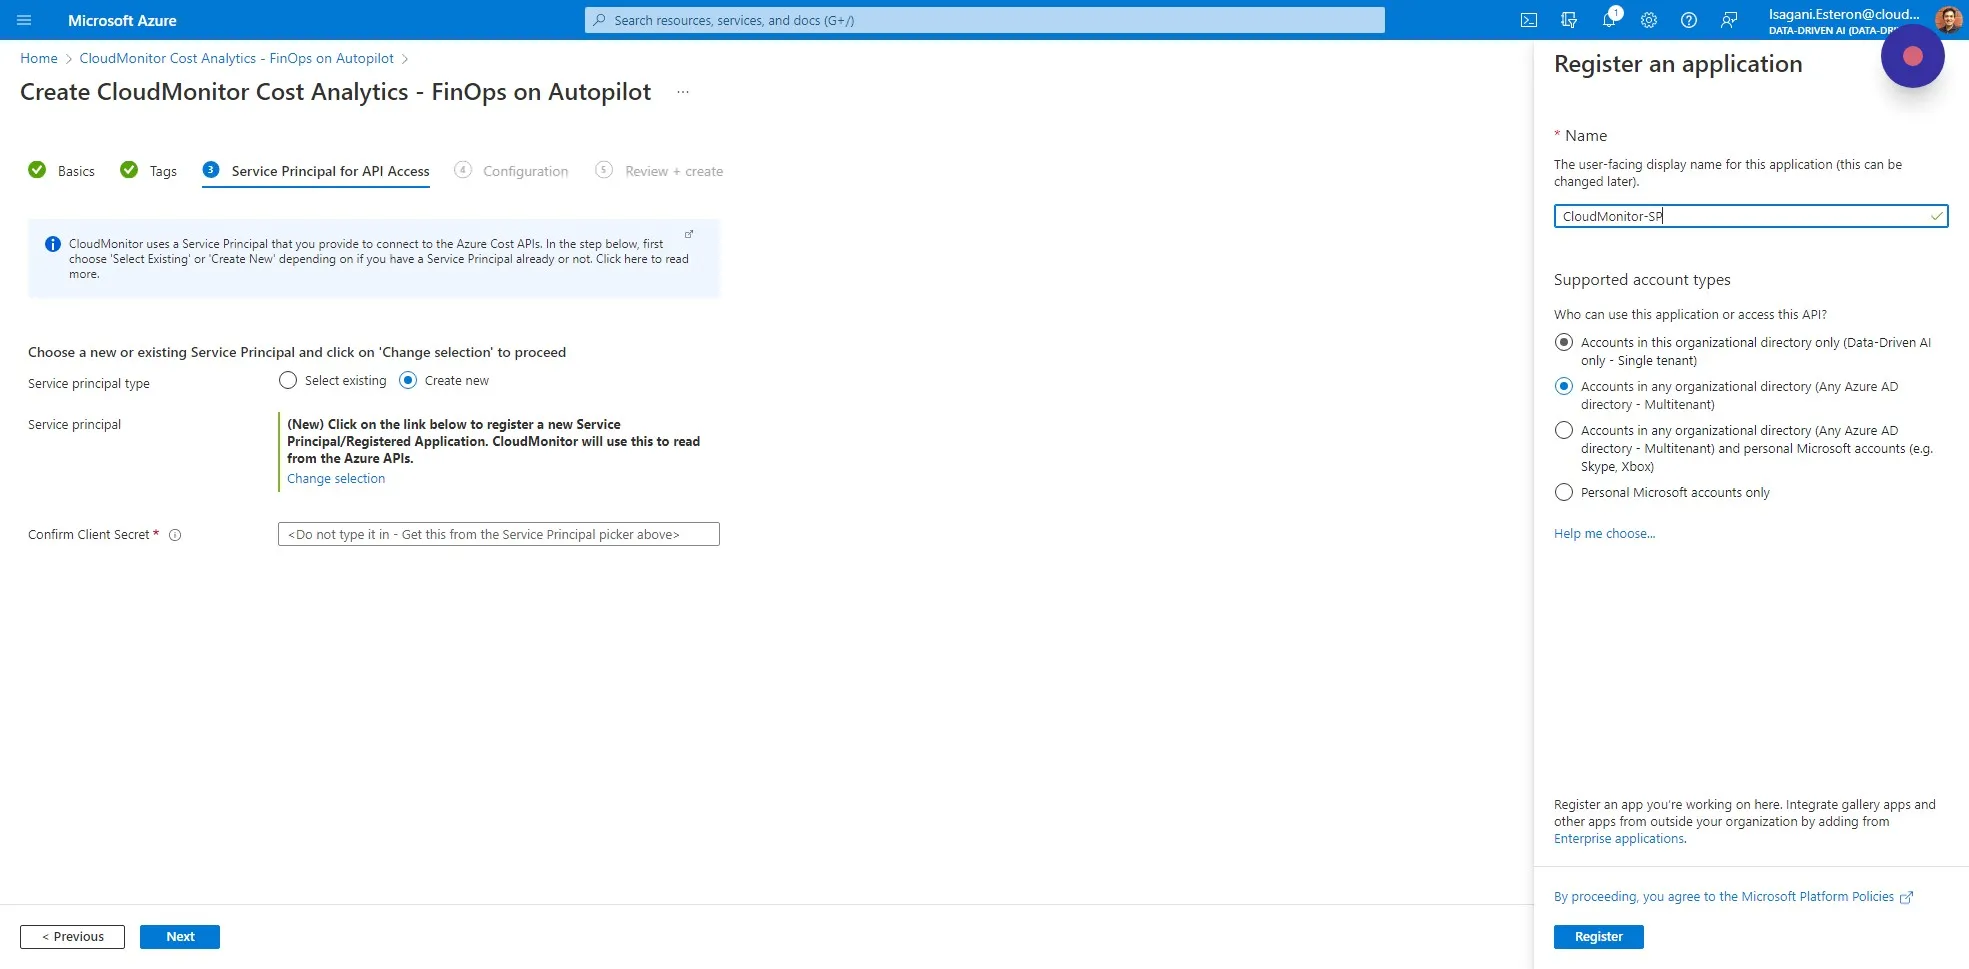
Section titled “Step 11”Enter a name like “CloudMonitor-SP” and make sure “Accounts in this organizational directory only” is selected, then click on Register.
Step 12
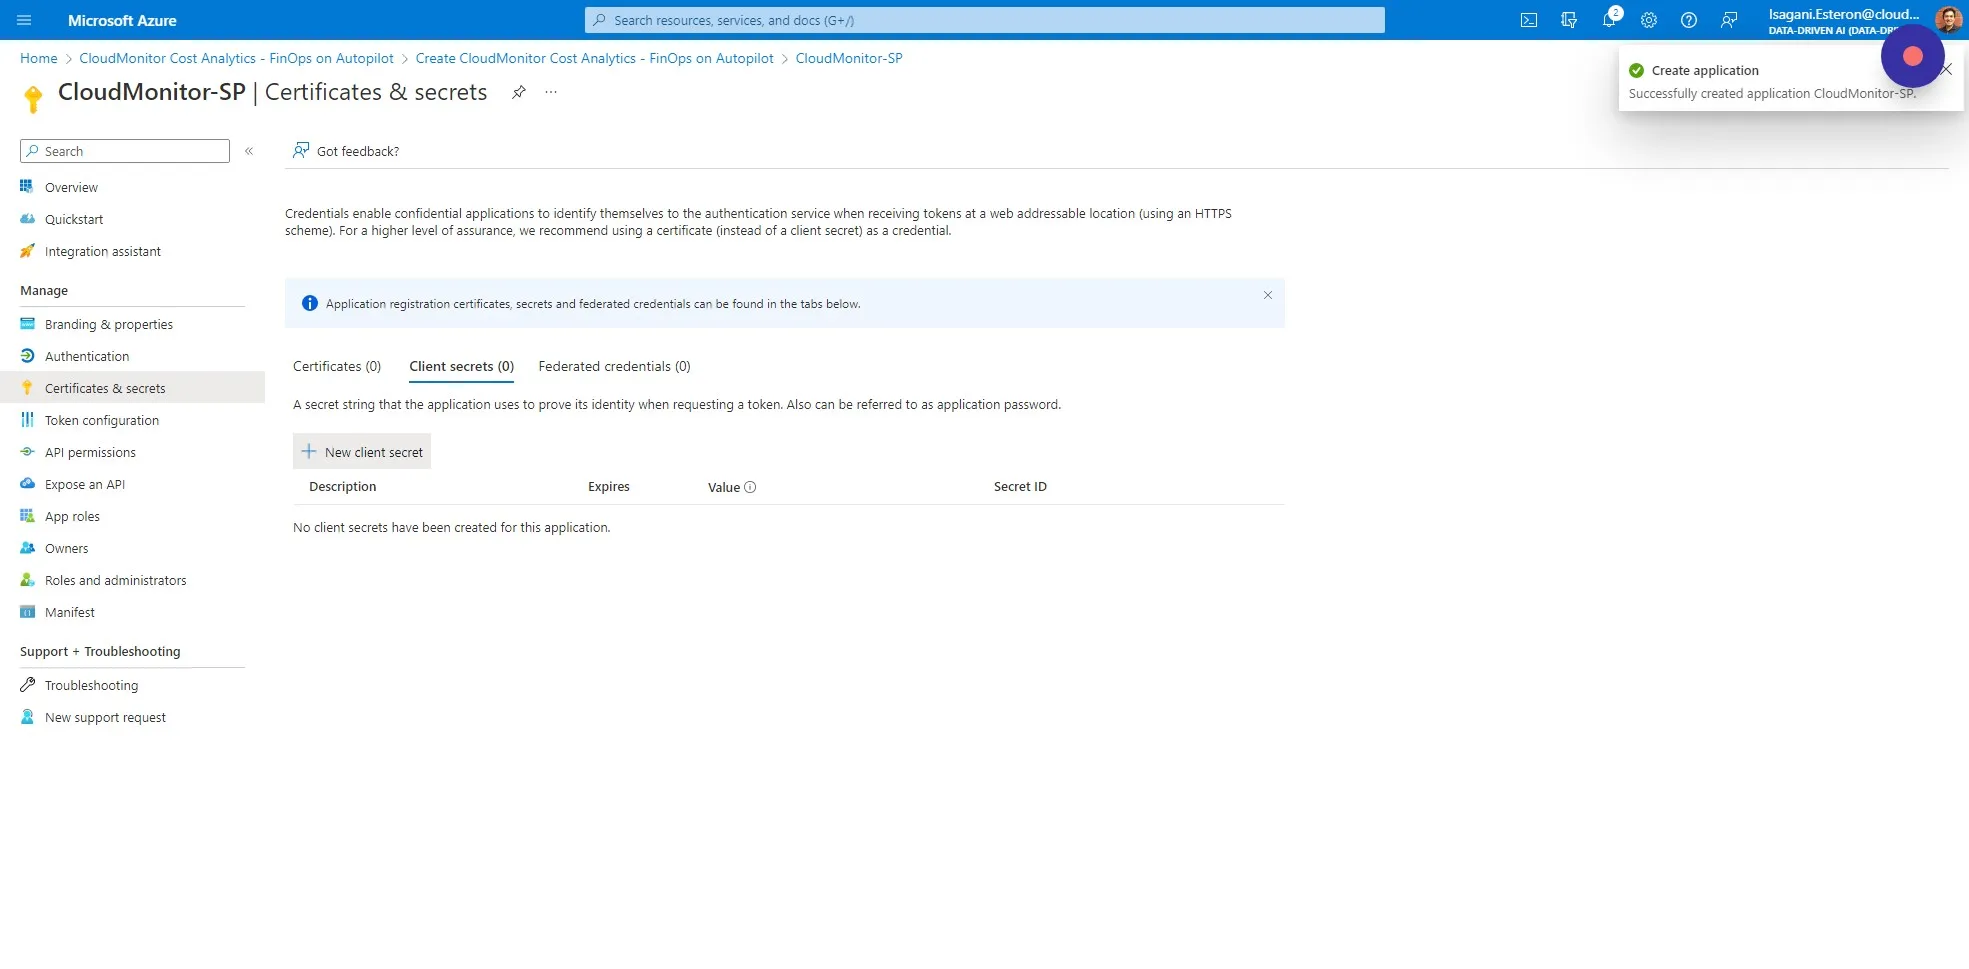
Section titled “Step 12”Go to the Certificates & Secrets tab in the left -hand menu and click “New client secret”.
Step 13
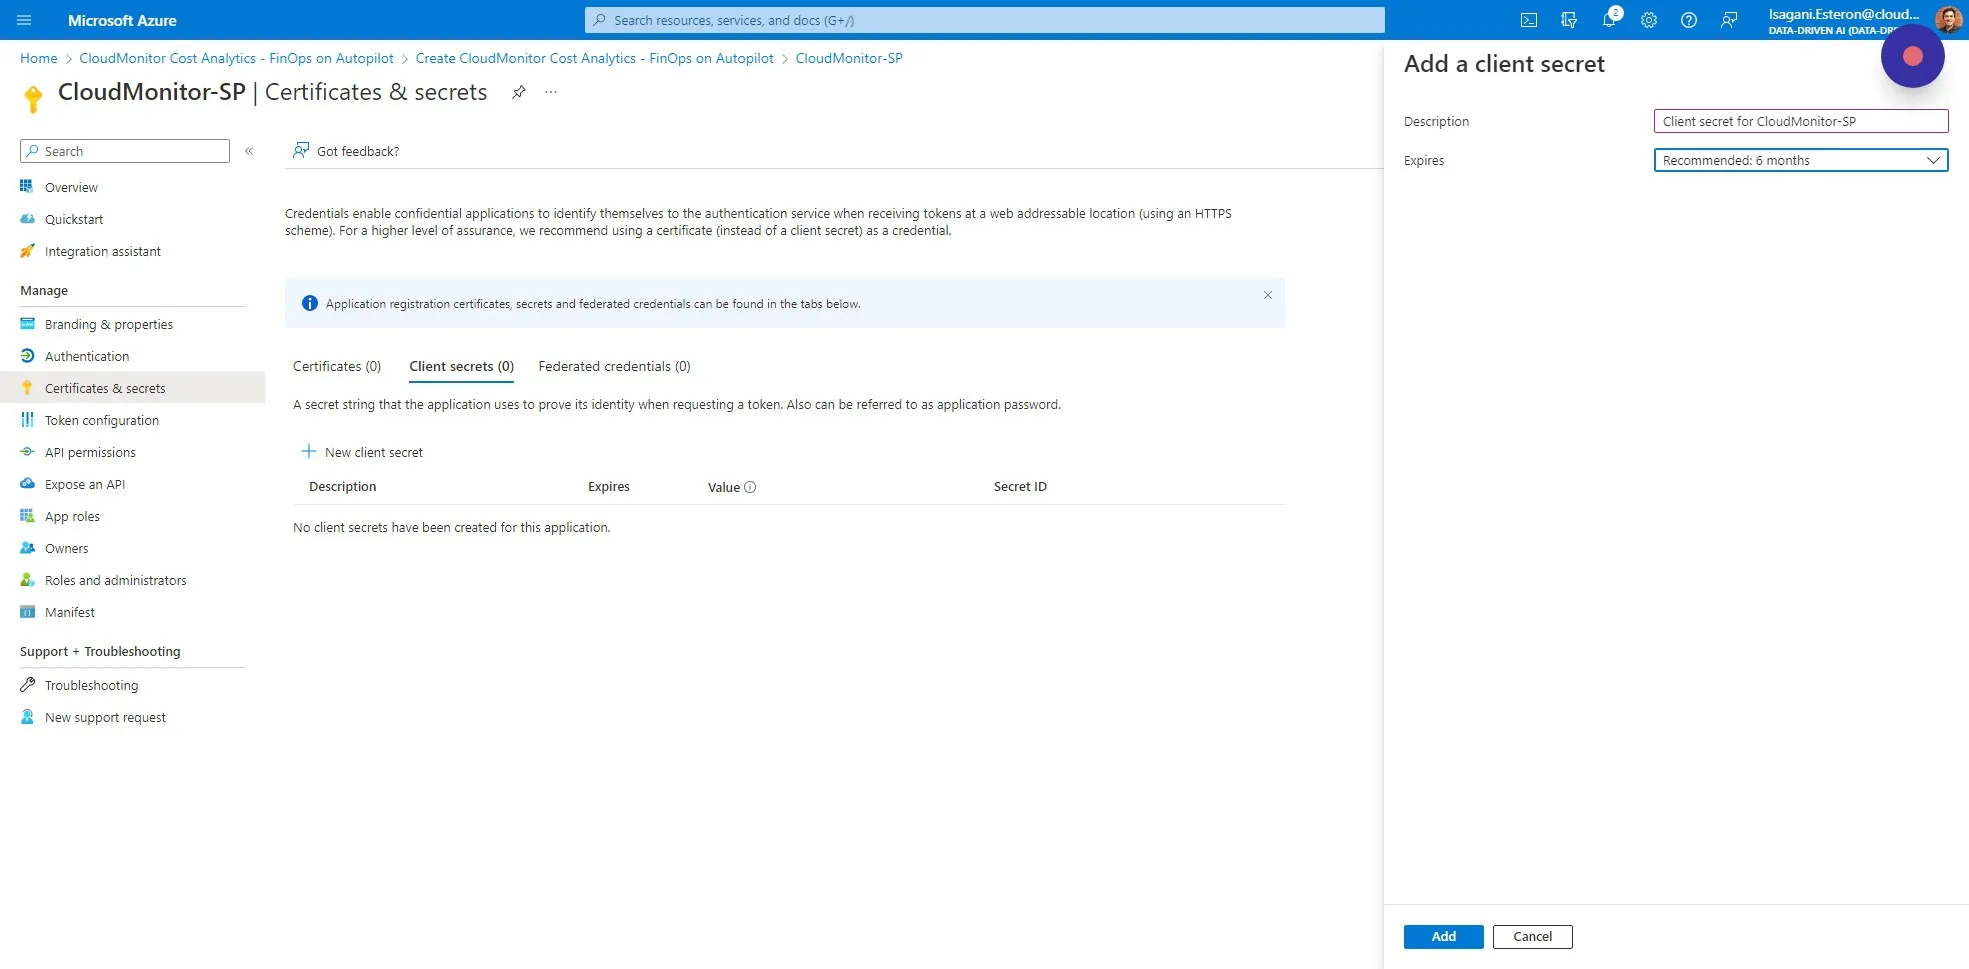
Section titled “Step 13”Fill in the “Description” field - we recommend something like “CloudMonitor Client Secret” and choose the amount of time that you want this secret to be valid for.
3 months is more secure but you will need to remember to change it when it expires or CloudMonitor will stop working. We recommend 12 months to avoid the effort of expiring secrets. Click on “Add” to proceed.
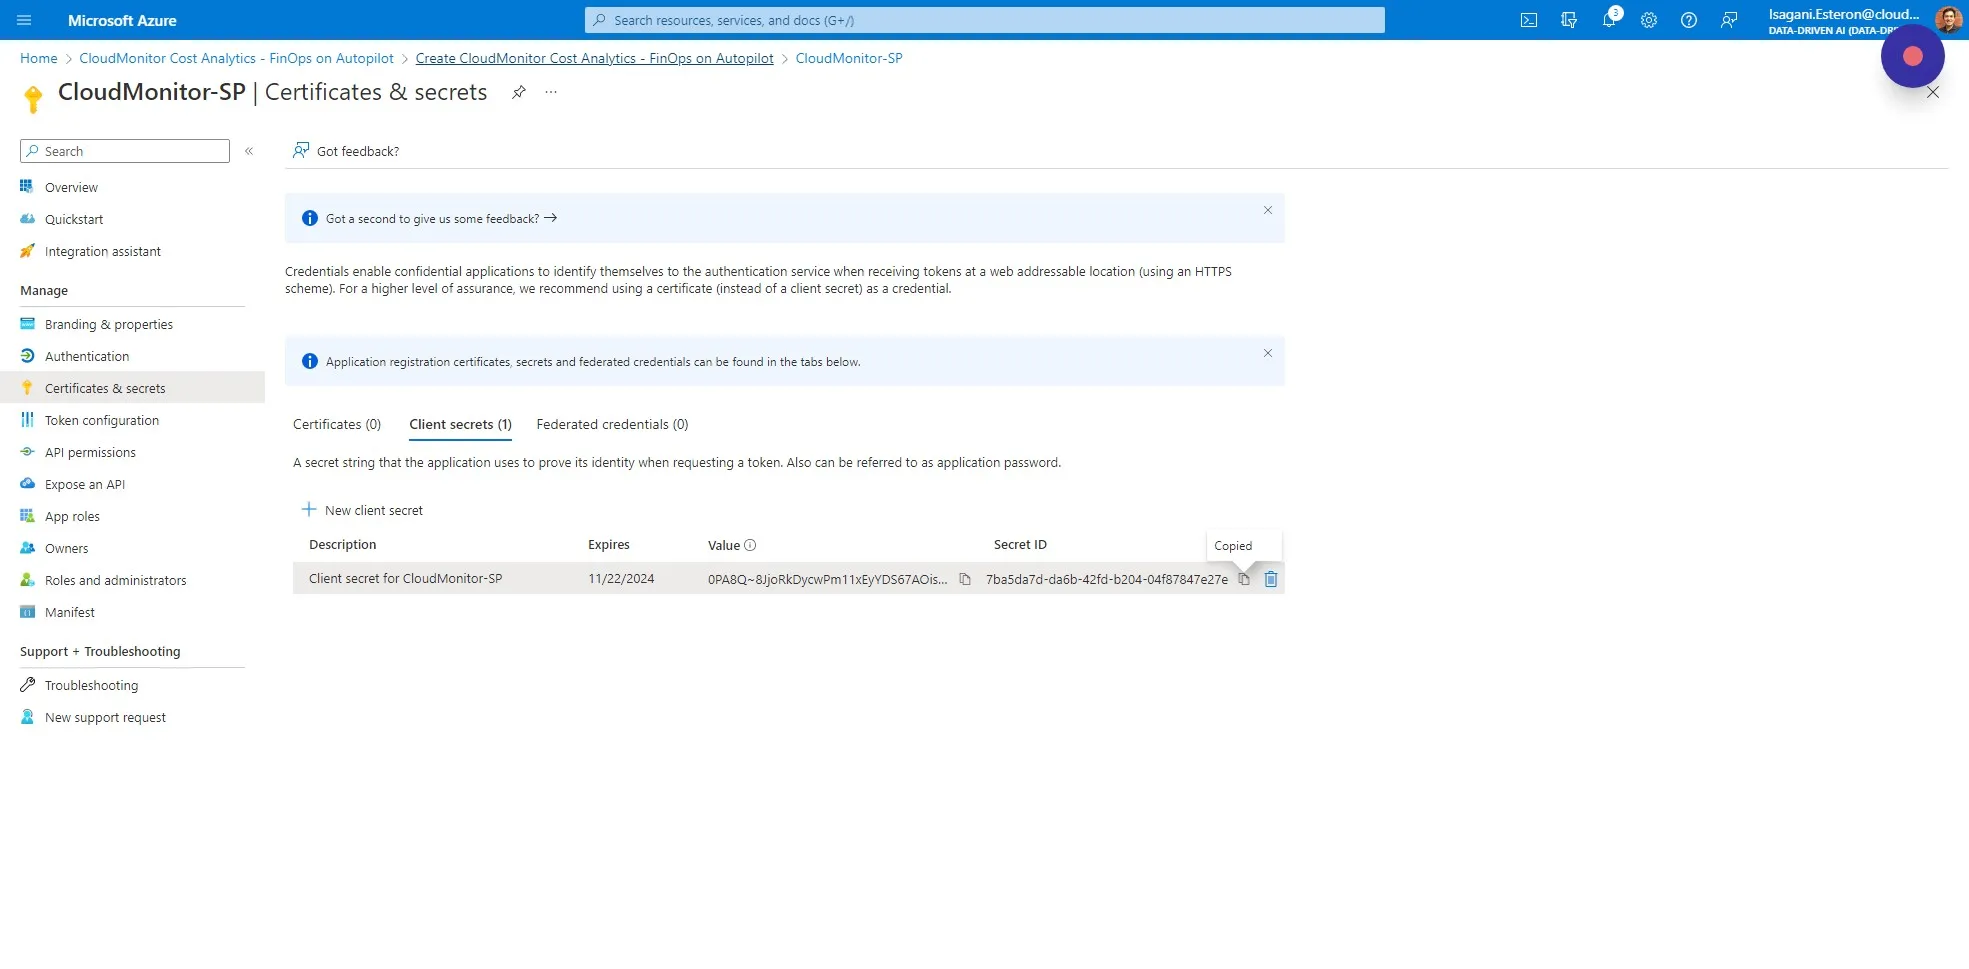
Step 14
Section titled “Step 14”Click on the clipboard to copy the Secret Value and store it in a safe place, like a Password Vault. You will not be able to copy this value again once you close this window, and we need it for a later step.

Step 15
Section titled “Step 15”Click “Create CloudMonitor Cost Analytics - FinOps on Autopilot” to go back to the installation wizard.
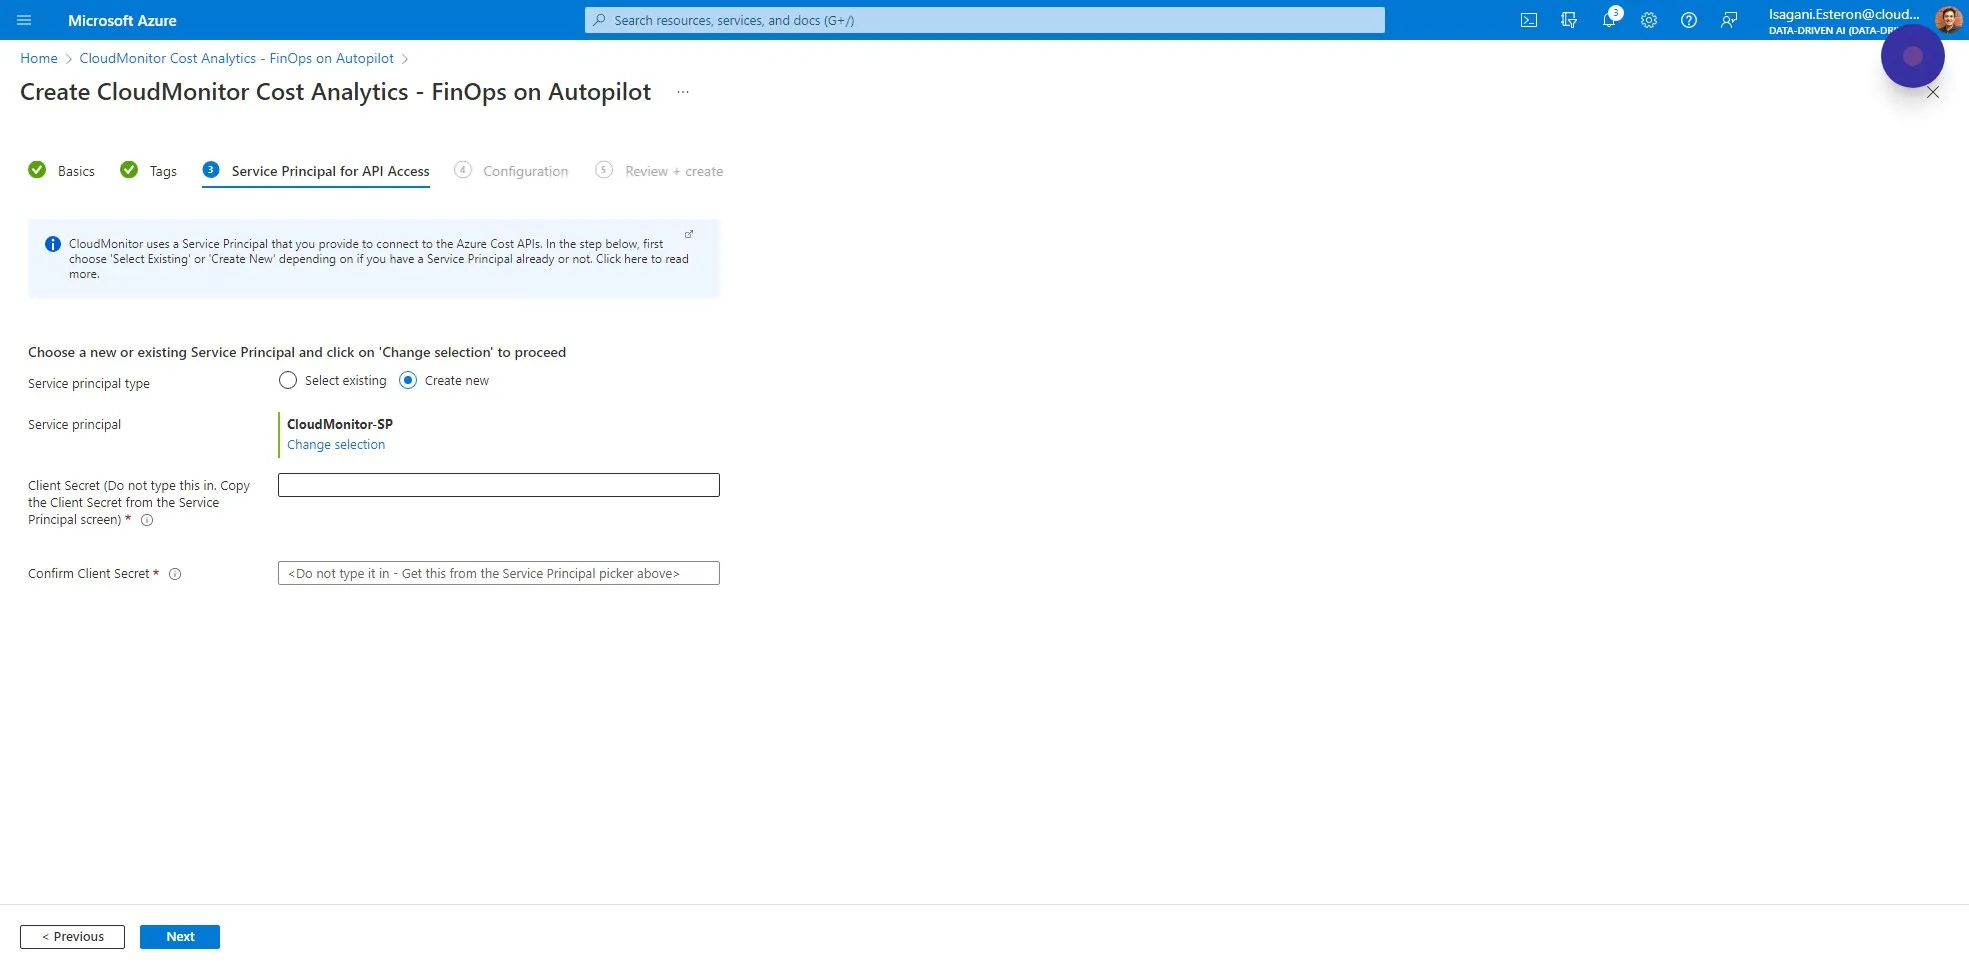
Step 16
Section titled “Step 16”You will notice the Service Principal that you created is now selected. Paste in the Client Secret Value from the clipboard you created in the previous step.
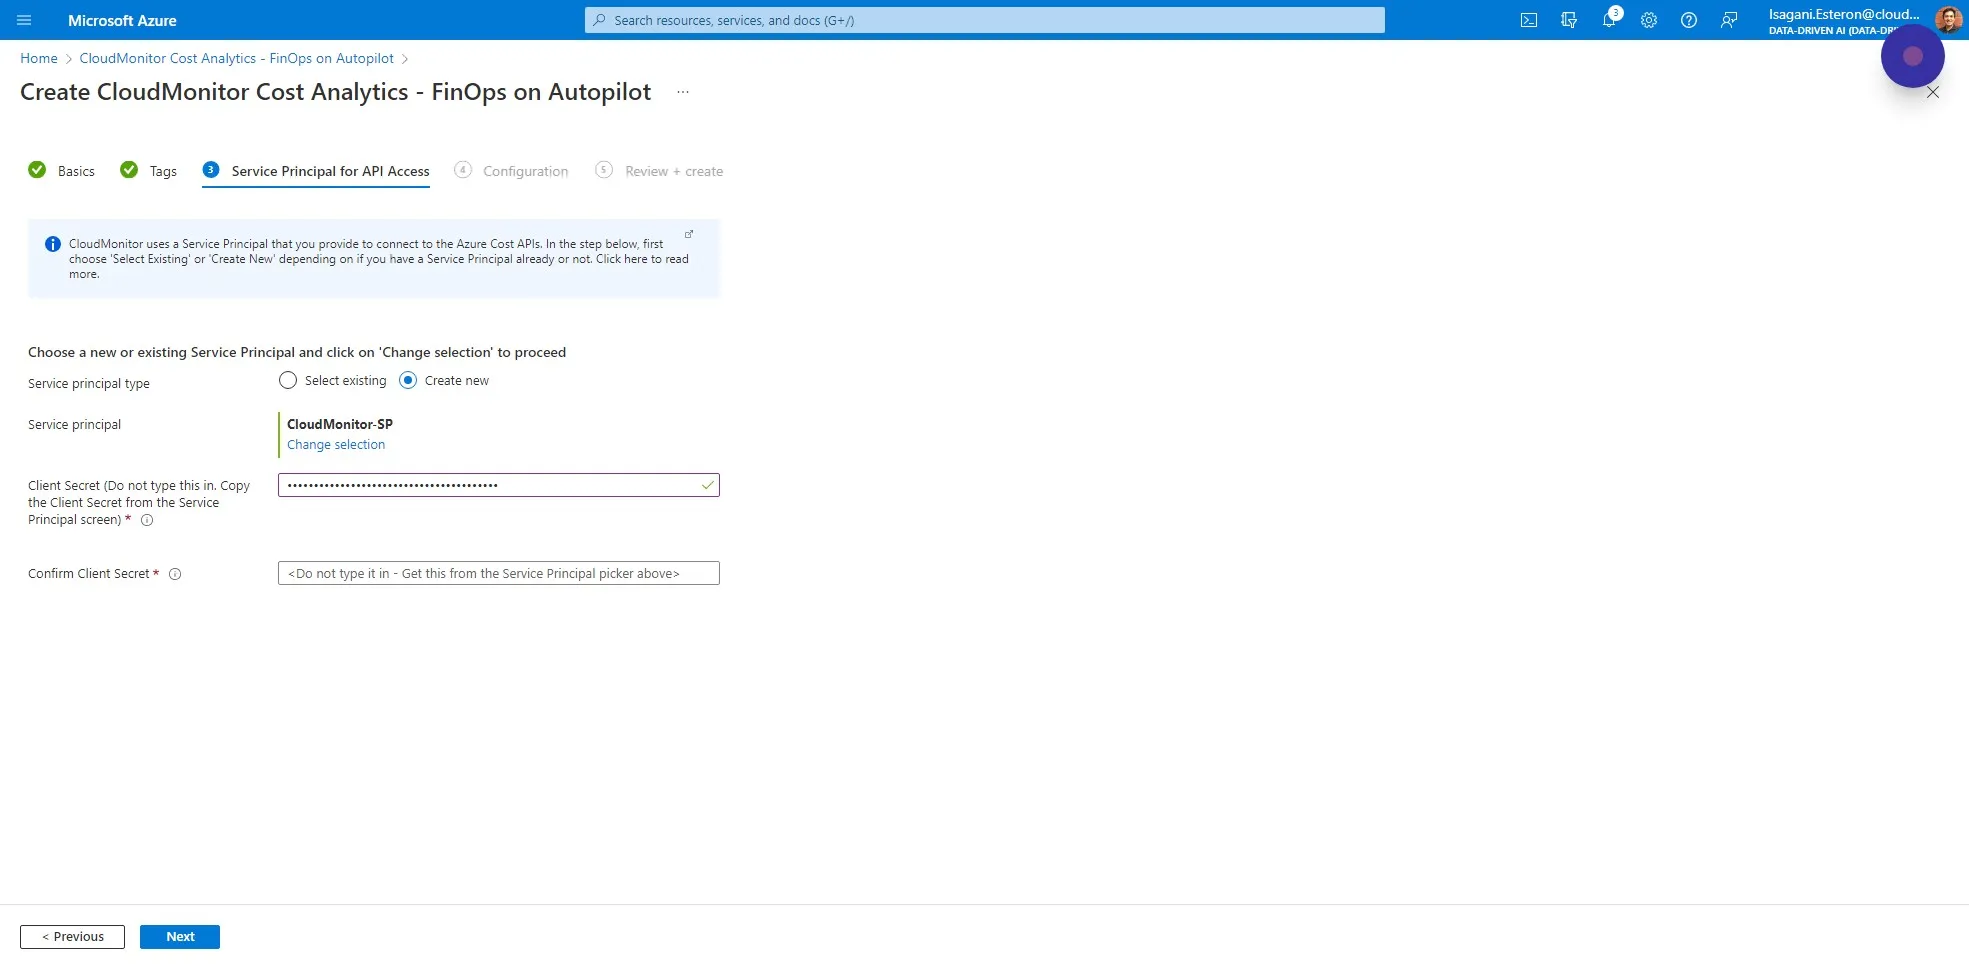
Step 17
Section titled “Step 17”and paste it again below to confirm that it is correct, then click on Next.
Step 18
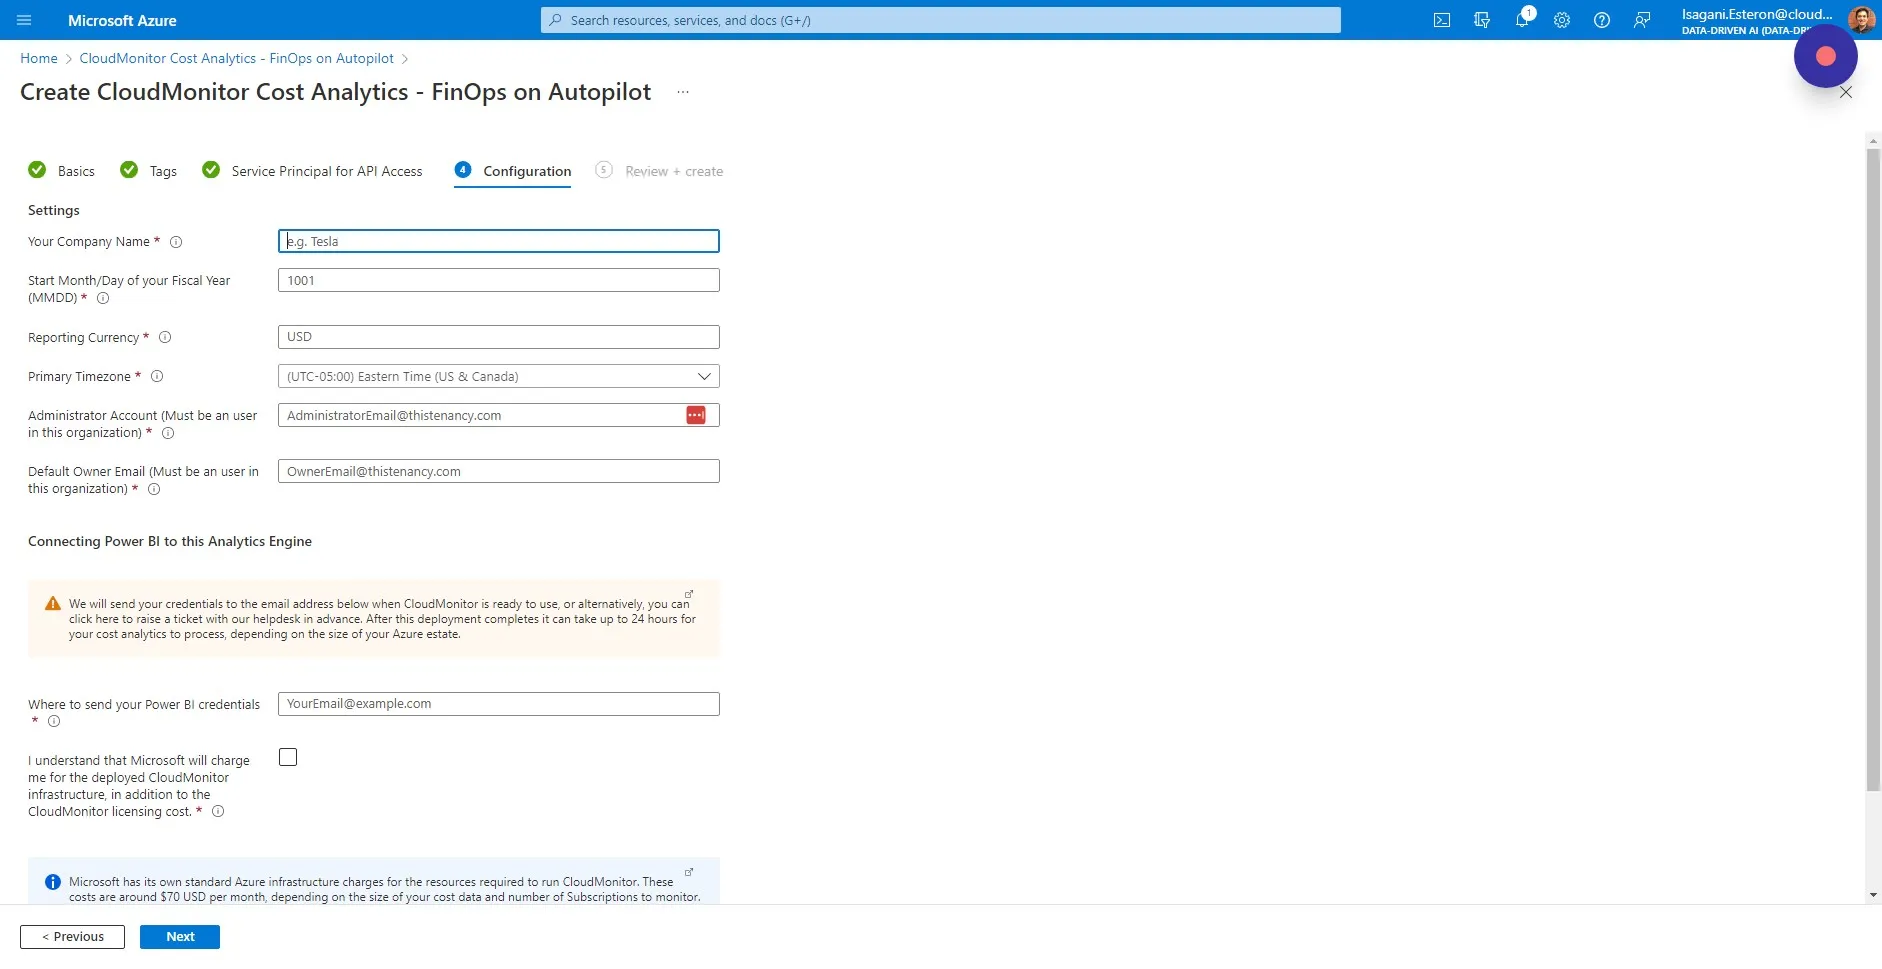
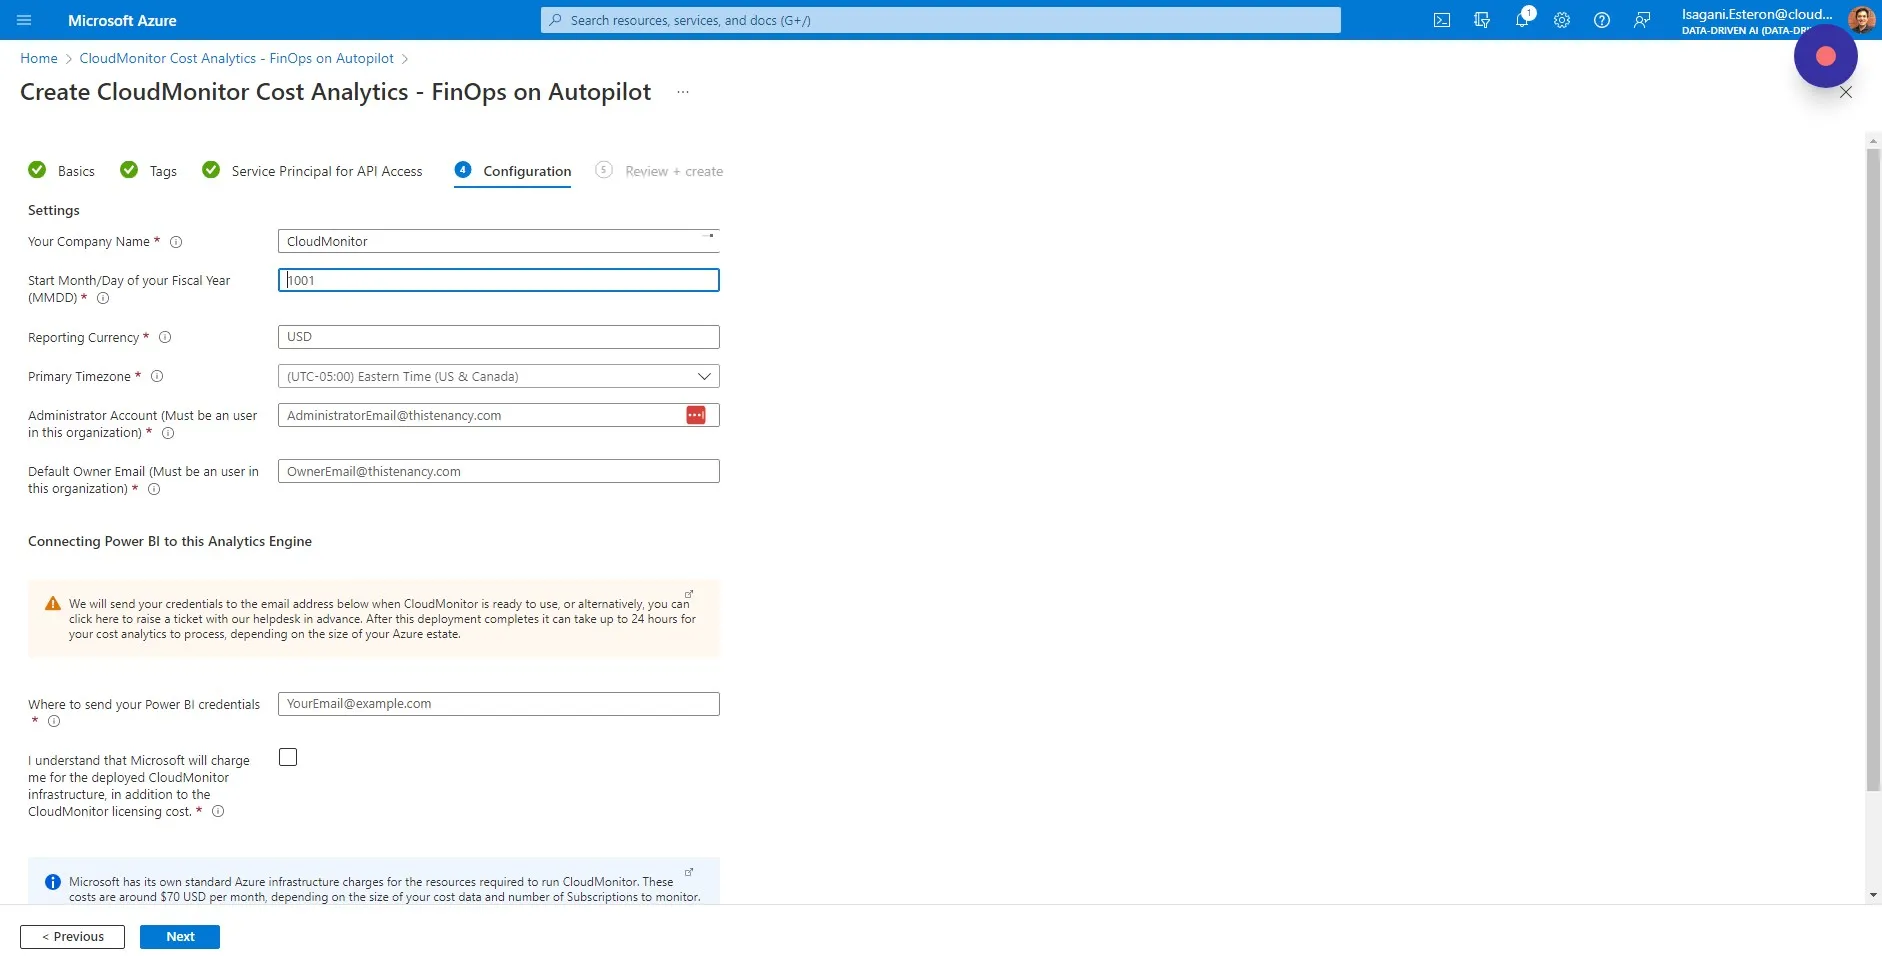
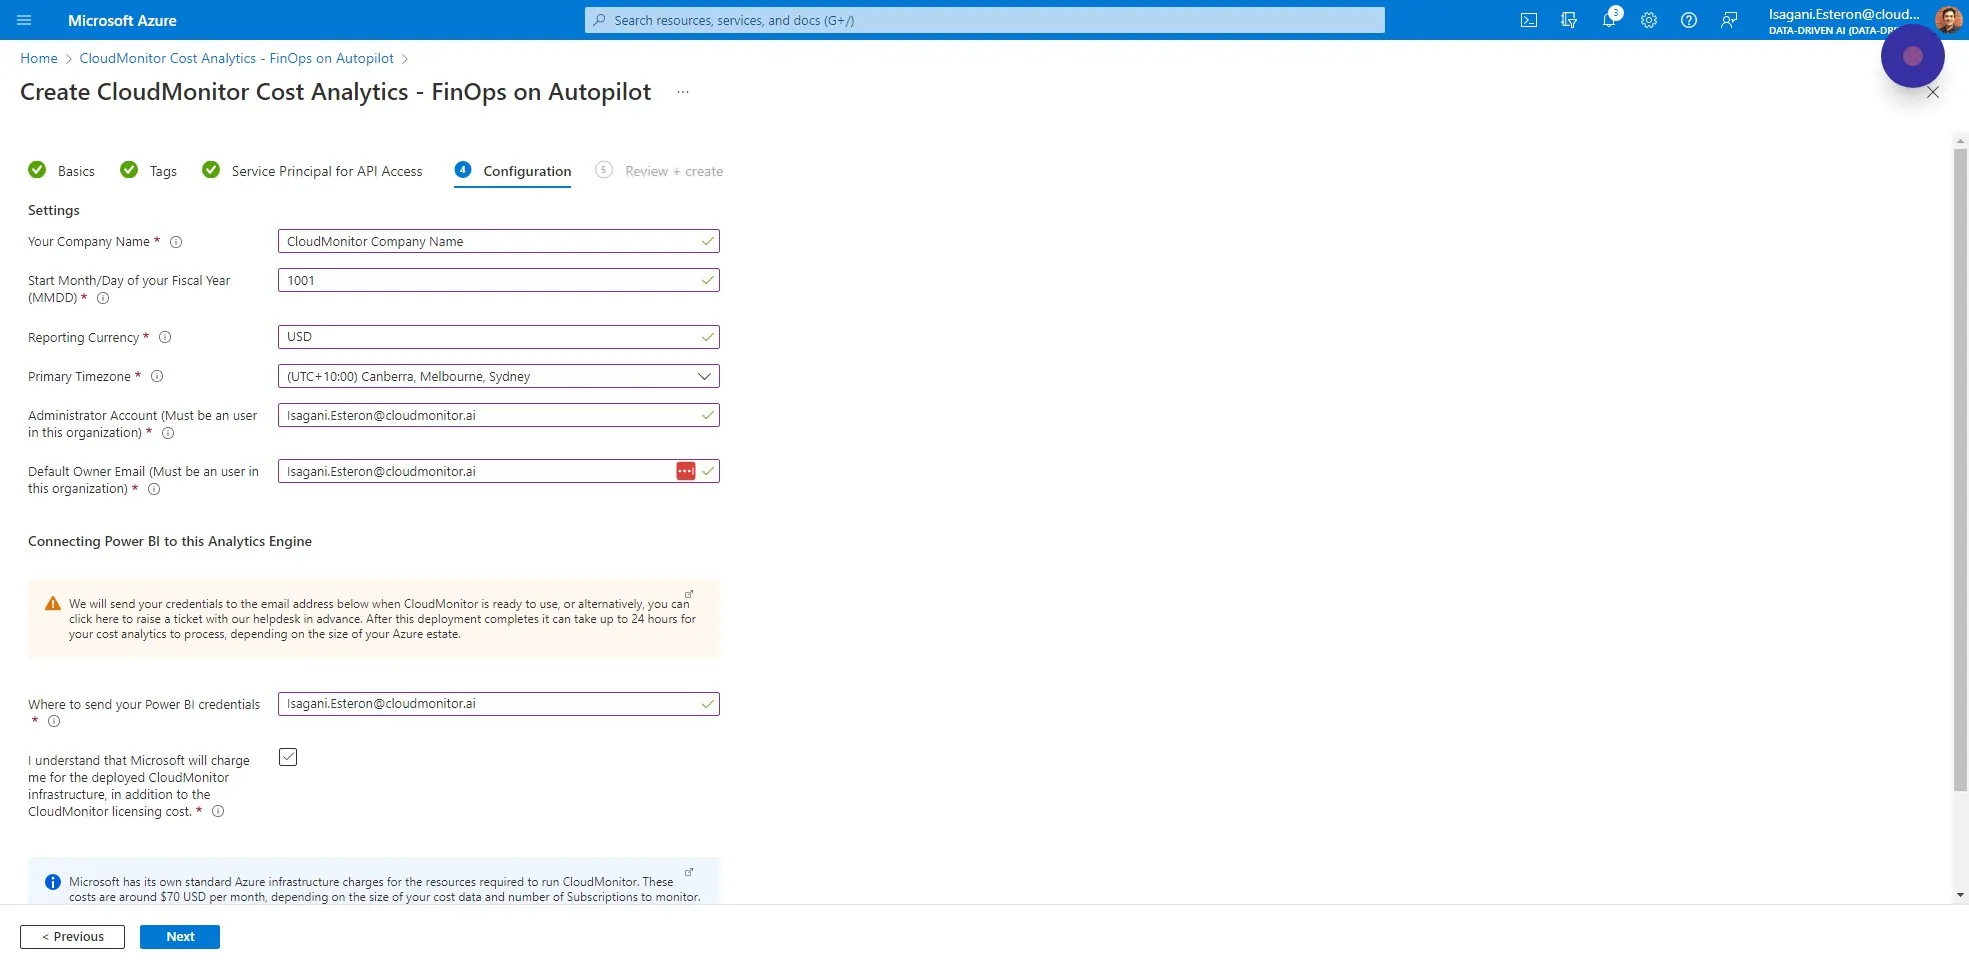
Section titled “Step 18”The Configuration tab is all about your company configuration.
Enter your company name first.
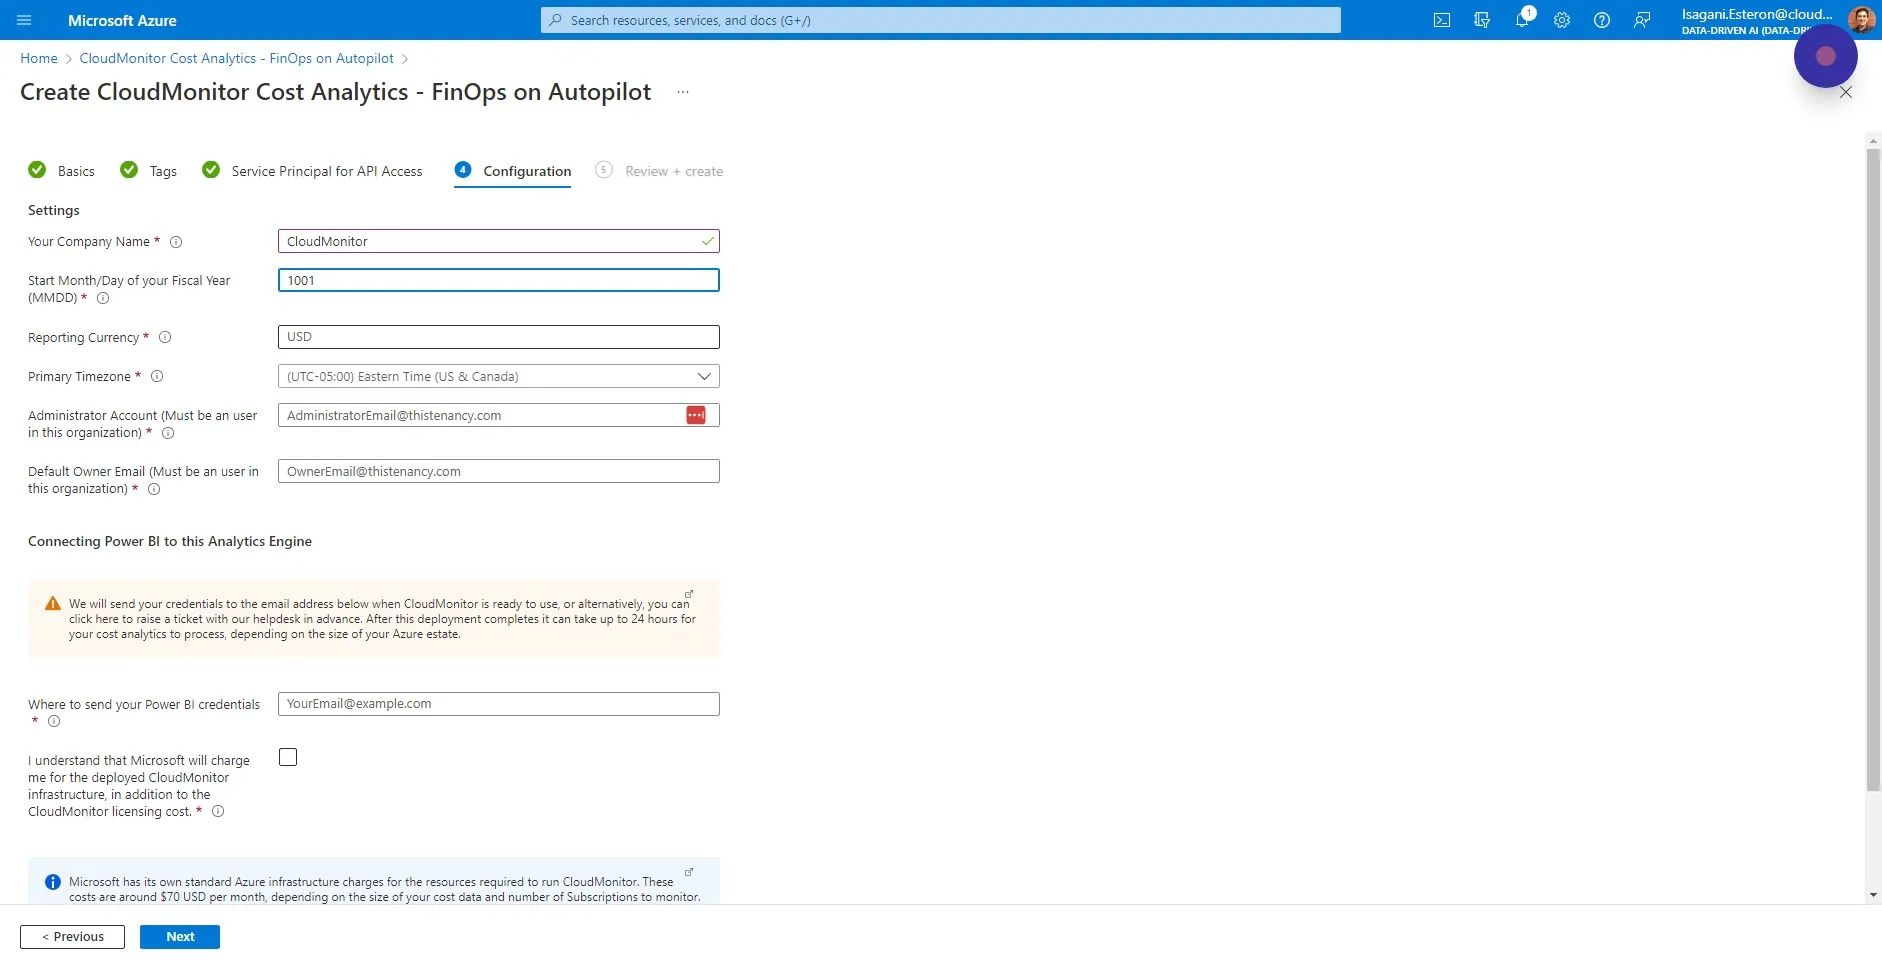
Step 19
Section titled “Step 19”Fill in the “Start Month/Day of your Fiscal Year (MMDD)” field.
For example, in Australia, the Financial Year is from the 1st of July to the 30th of June, so you would enter 0701 (July the 1st). In the UK, it is from the 6th of April, so you would enter 0406.
Step 20
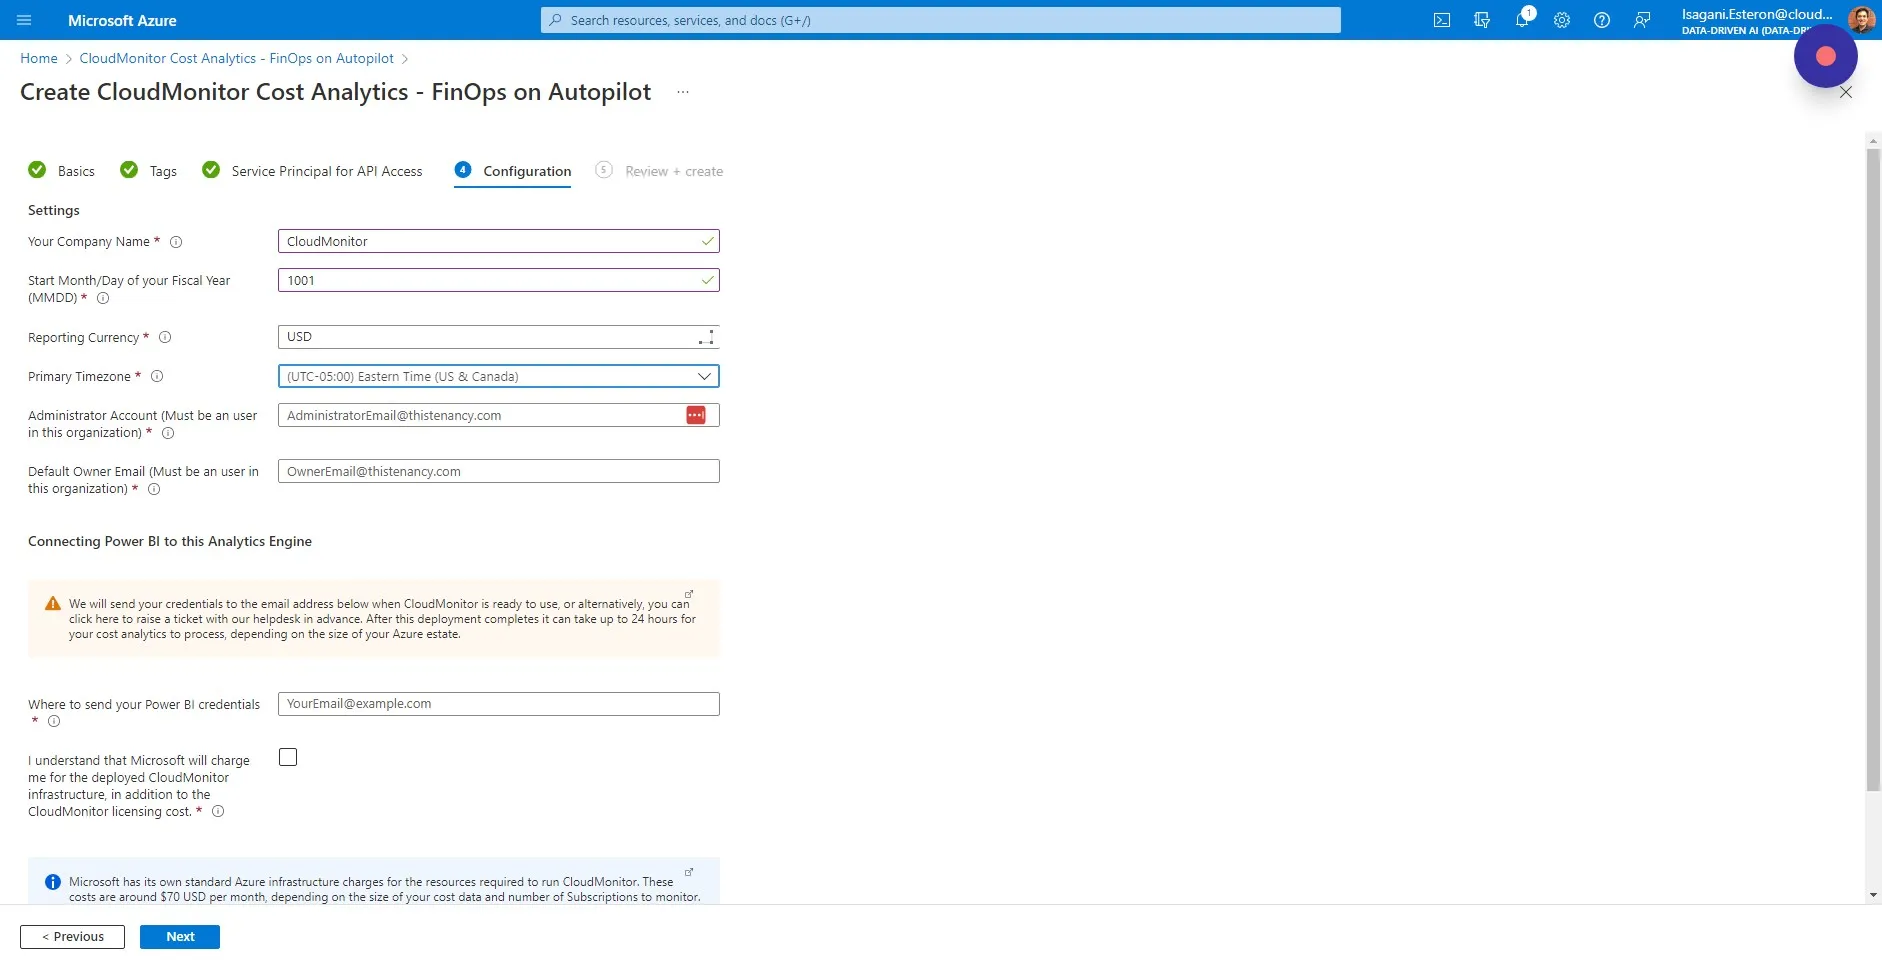
Section titled “Step 20”Fill in the “Reporting Currency” field. If your Azure billing is in Indian Rupees, put INR. If it is US dollars, put USD.
Step 21
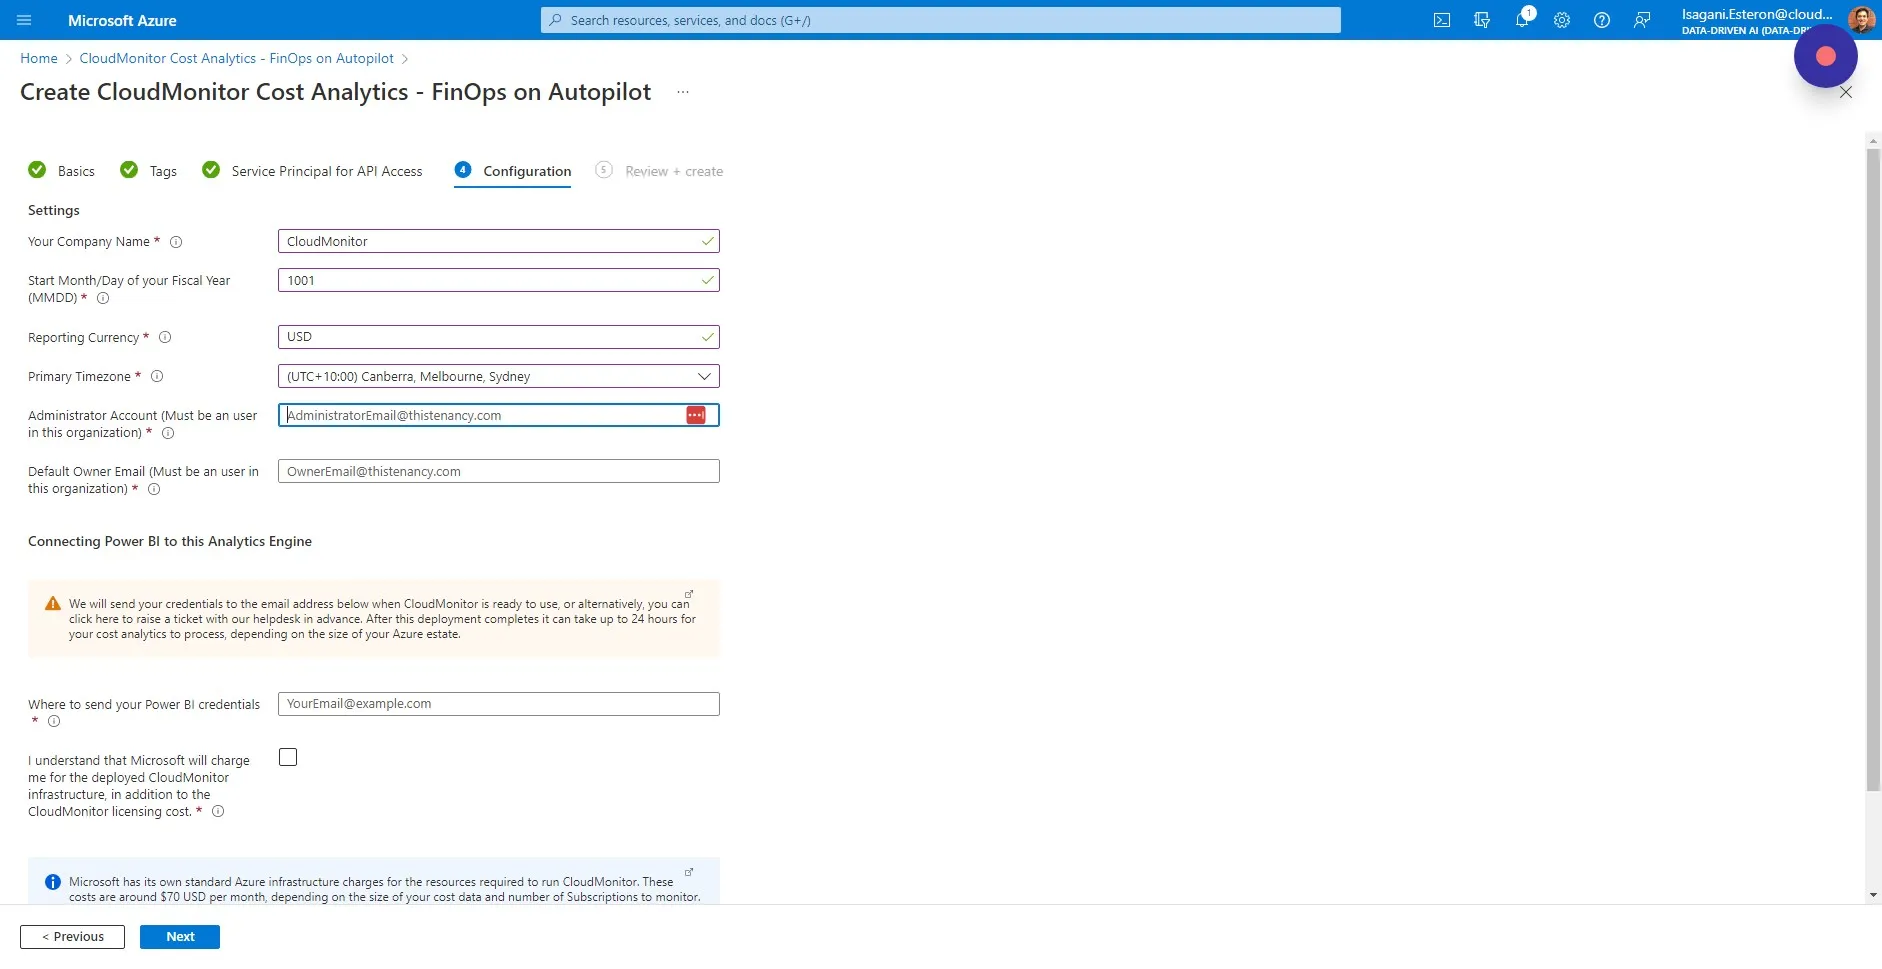
Section titled “Step 21”Select your Primary Timezone. This is used for optimizing the performance of CloudMonitor as costs for Azure are refreshed in your timezone/region.
Step 22
Section titled “Step 22”Fill in the “Administrator Account” field. It is important that this user is a valid email in your Azure Active Directory. This account will be the first Administrator in the CloudMonitor Admin App who can invite other users and promote users to be Admins.
Step 23
Section titled “Step 23”Fill in the “Default Owner Email” field. The “Owner” is the user who is responsible for Azure Resources, which is sometimes different from the technical owner/created-by person.
CloudMonitor uses an algorithm to work out who the Owner is, and they can be reassigned in the Admin App. If no Owner is found, the Default Owner is used.

Step 24
Section titled “Step 24”Enter the email of the person who will be connecting Power BI to the CloudMonitor Analytics Engine.
We will send all communications around the technical installation of CloudMonitor to this person. It is not used for anything else.

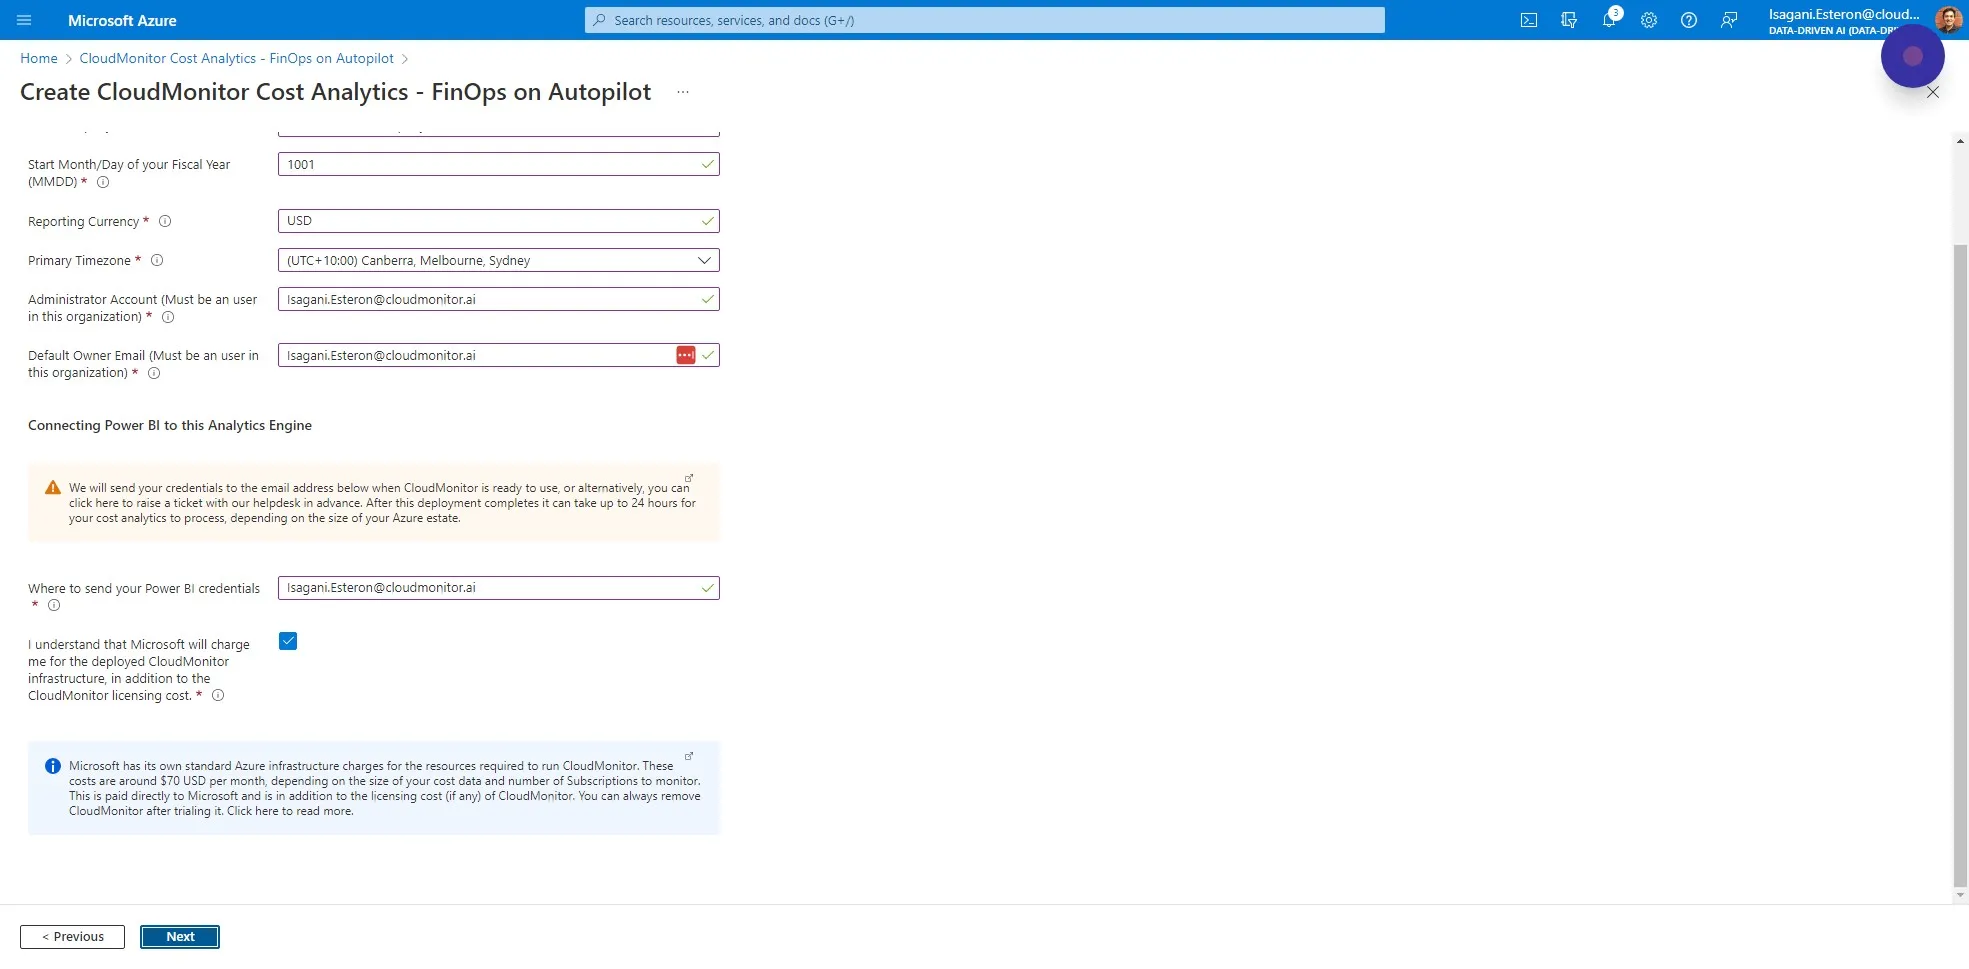
Step 25
Section titled “Step 25”Please ensure that you have read and understand how Microsoft charges for Infrastructure and check this box when you are happy to continue.
Step 26
Section titled “Step 26”Click on “Next” to proceed to the next tab.
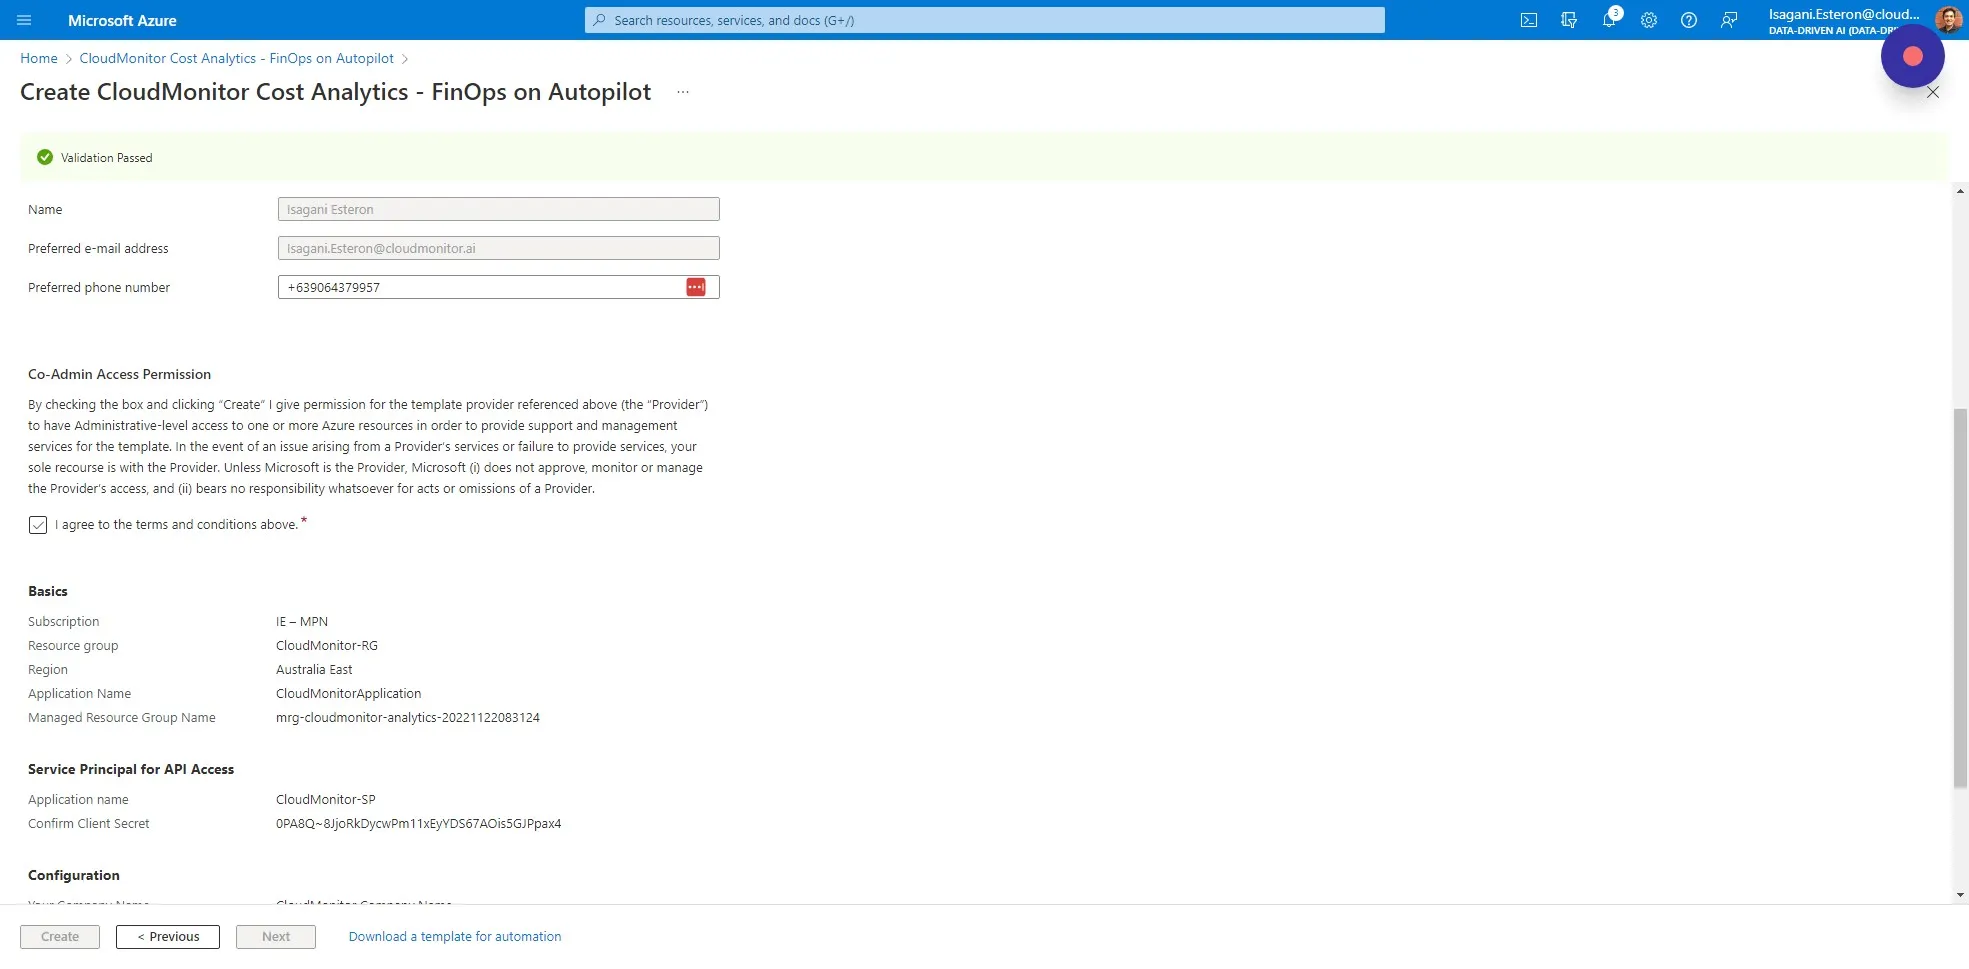
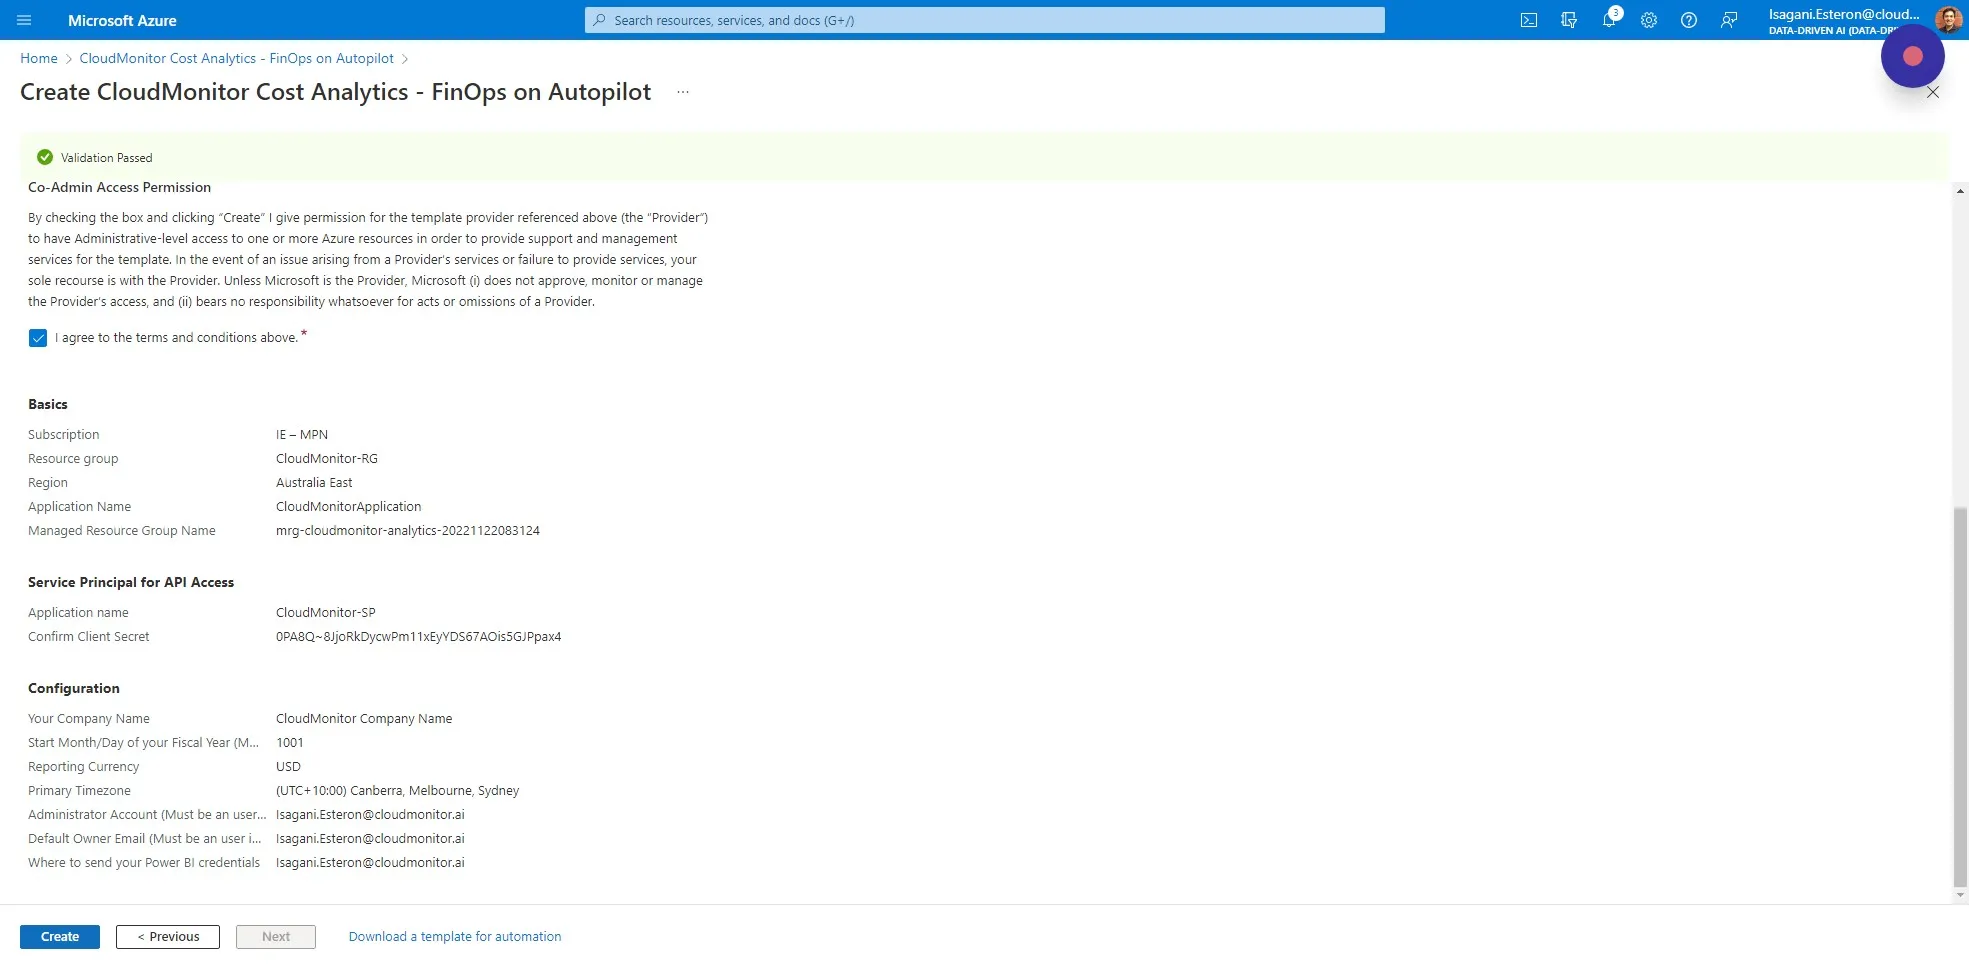
Step 27
Section titled “Step 27”The final tab is a summary of the deployment. Read through the details and check the Terms and Conditions if you would like to proceed.
Step 28
Section titled “Step 28”Click “Create” to start the CloudMonitor deployment on Azure.
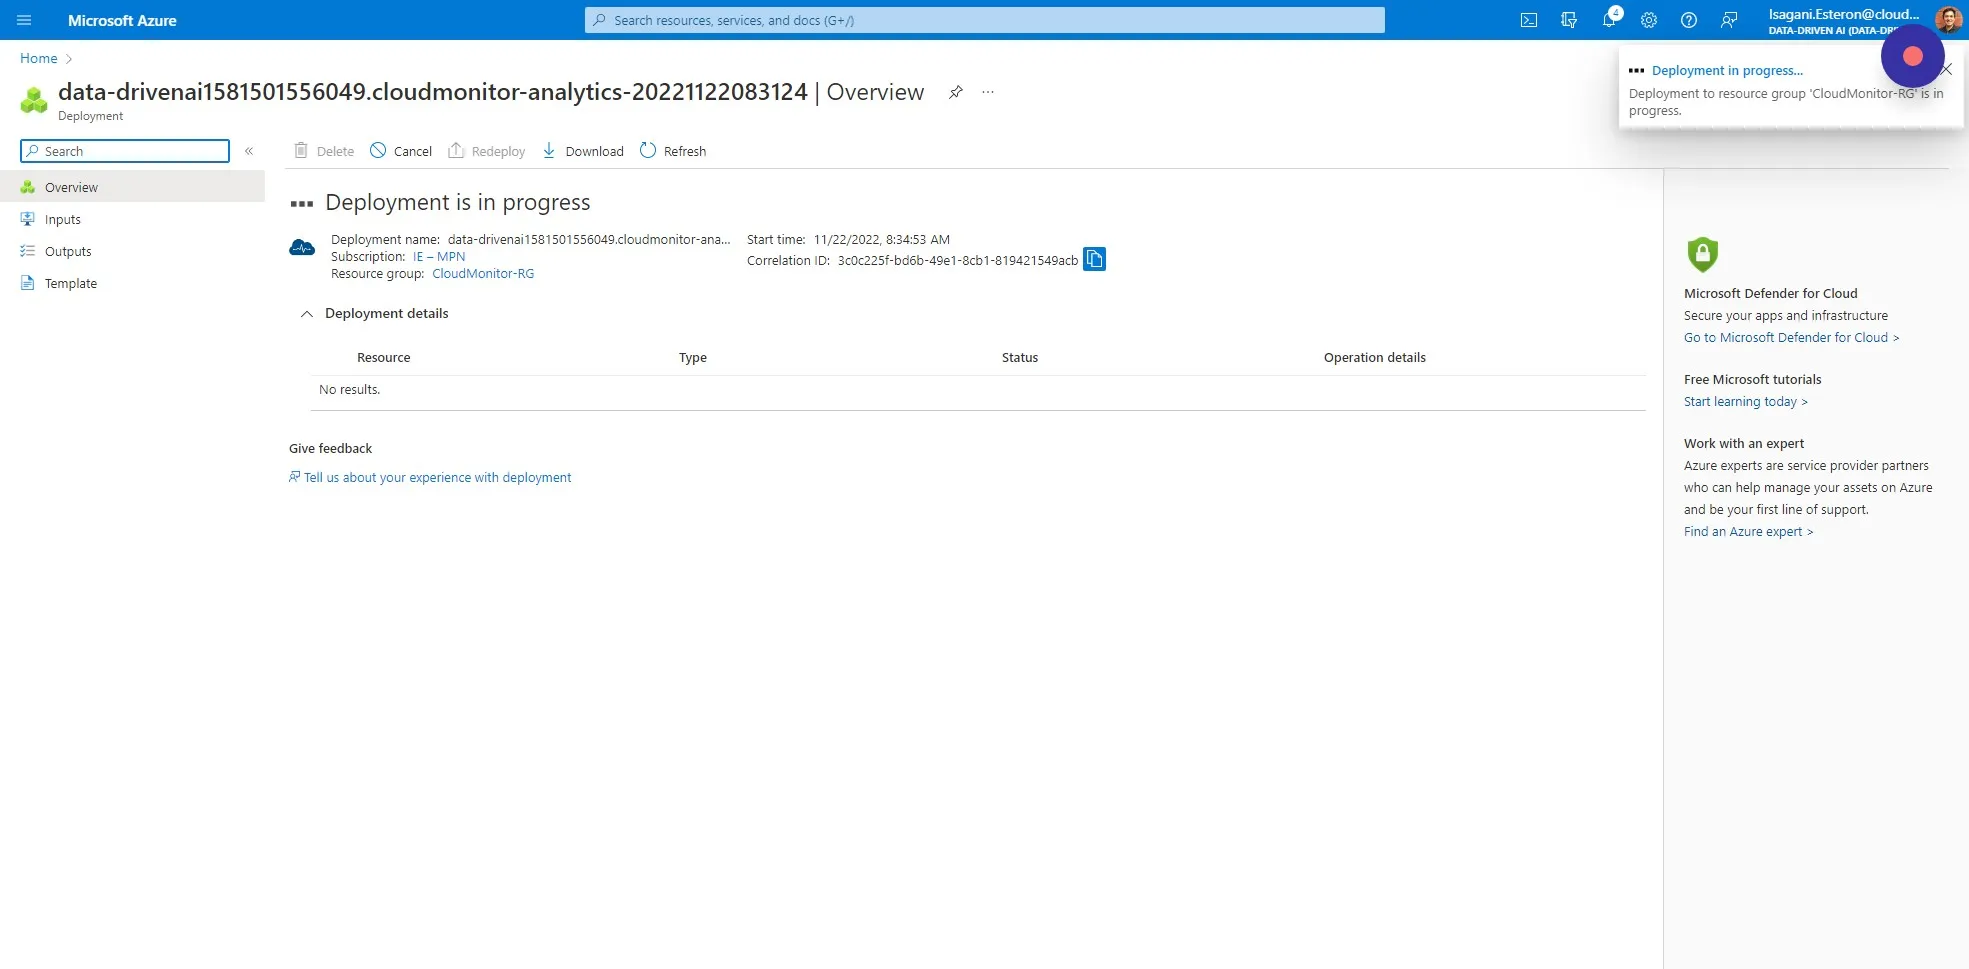
Step 29
Section titled “Step 29”The deployment can take between 10 and 45 minutes. Azure will update you when it is complete.
Step 30
Section titled “Step 30”After successful installation of the CloudMonitor Analytics Engine, please move on to Step 2 to configure Azure Synapse. Step 2: Configure Azure Synapse : CloudMonitor Helpdesk[[ ]]